
Fig. 4
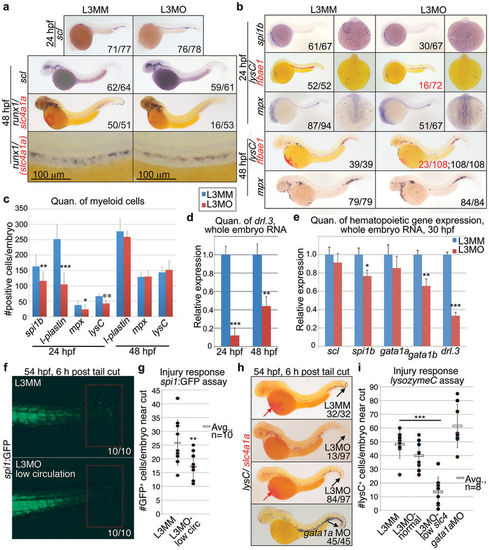
Knockdown of drl.3 transiently decreases myeloid cells without altering the emergence of primitive progenitor and definitive stem cells. (a) WISH of scl at 24 and 48 hpf, and runx1 (dark blue)/slc4a1a (red) at 48 hpf in L3MM- and L3MO-injected embryos, as labeled. Embryos shown as lateral views. (b) WISH of spi1b, l-plastin and mpx at 24 hpf and l-plastin and mpx 48 hpf. Dorsal, anterior (24 hpf only, right panels) and lateral views are shown. (c) Quantitation of the number of the WISH spi1b+, l-plastin+ and mpx+ cells in the anterior of the embryo at 24 hpf and total body l-plastin+ and mpx+ cells at 48 hpf in L3MM (blue) and L3MO-injected (red) embryos (N = 8 for each column except for mpx at 24 hpf where N = 15, bars show mean ± S.E.). **P = 0.0044, ***P < 0.0001 and *P = 0.0156 (Student's t-test). (d) Quantitative real-time PCR analysis of drl.3 in whole embryo RNA samples from 24 and 48 hpf drl.3 morphants (red) and controls (L3MM, blue, set to 1, arbitrary units). **P = 0.0042 and ***P < 0.0001 (Student's t-test). (e) Quantitative real time PCR analysis of scl, spi1b, gata1a, gata1b, and drl.3 in whole embryo RNA samples from pools of 30 hpf drl.3 morphants (red) compared to control-injected embryos (blue, set to 1, arbitrary units). *P = 0.0114, **P = 0.0083 and ***P = 0.0005 (Student's t-test). (d–e) Bars show mean ± S.D., from three independent experiments. Expression was normalized to gapdh. (f) Tail region of spi1:GFP embryos at 54 hpf, 6 hours after tail transection. Selected L3MO embryos had decreased circulating cells; controls were randomly selected, and had normal circulation. Red boxes = tail cut region. (g) Number of spi1:GFP+ cells in tail cut region in control or drl.3 morphants. P = 0.007 (Student's t-test). (h) WISH of lysozymeC/lysC (blue) and slc4a1a (red) at 54 hpf, 6 hours after tails were cut. (i) Number of lysC+ cells in an equal sized region surrounding the tail in the indicated embryos at 54 hpf, 6 hours after tail cuts were performed. P = 6.77E-5, Student's t-test. |
| Genes: | |
|---|---|
| Fish: | |
| Knockdown Reagent: | |
| Anatomical Terms: | |
| Stage Range: | Prim-5 to Long-pec |
| Fish: | |
|---|---|
| Condition: | |
| Knockdown Reagent: | |
| Observed In: | |
| Stage Range: | Prim-5 to Long-pec |