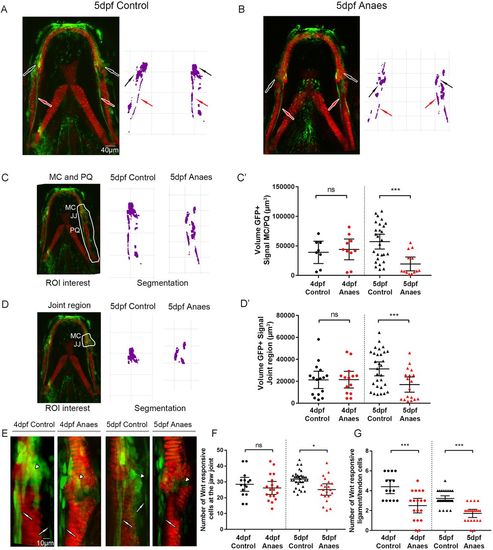
Immobilisation causes a reduction in canonical Wnt signalling activity at the zebrafish lower jaw. (A,B) Tg(7xTCF.XlaSiam:nlsGFP) and Tg(Col2a1aBAC:mcherry) transgenic zebrafish lines were used to visualise Wnt-responsive cells (green) and chondrocytes (red) in 5 dpf control (A) and 5 dpf immobilised (B) zebrafish. Anaes, anaesthetised larvae from 3 to 5 dpf. Left: merge of Tg(7xTCF.XlaSiam:nlsGFP) and Tg(Col2a1aBAC:mcherry). Right: segmentation of GFP signal. Black arrows indicate cells surrounding the jaw joint; red arrows indicate ligaments and tendons. (C) Left: volume analysis of Tg(7xTCF.XlaSiam:nlsGFP) GFP+ signal at the region of interest (ROI) from six intercalating cells above the Meckel's cartilage (MC) jaw joint (JJ) and along the full extent of the palatoquadrate (PQ) (white line). Right: segmentation of GFP+ signal volume from the ROI in 5 dpf control and anaesthetised zebrafish. (C′) Volume (µm3) of GFP+ signal at the MC joint and along the PQ in 4 and 5 dpf control and anaesthetised zebrafish (n=8, 10, 27 and 13 joints). (D) Left: volume analysis of Tg(7xTCF.XlaSiam:nlsGFP) GFP+ signal at the ROI from six intercalating cells above the MC jaw joint to the interzone (white line). Right: segmentation of GFP+ signal volume from the ROI in 5 dpf control and anaesthetised zebrafish. (D′) Volume (µm3) of GFP+ signal at the MC joint in 4 and 5 dpf control and anaesthetised zebrafish (n=16, 14, 30 and 18 joints). (E) Tg(7xTCF.XlaSiam:nlsGFP) and Tg(Col2a1aBAC:mcherry) transgenic zebrafish with Wnt-responsive cells and cartilage of the lower jaw at the jaw joint labelled in 4 and 5 dpf control and anaesthetised zebrafish. White arrowheads indicate joint-associated GFP+ cells. White arrows indicate ligament and tendon GFP+ cells. (F) Number of GFP+ cells in 4 and 5 dpf control and anaesthetised zebrafish in a 50×80 µm area surrounding the jaw joint (n=15, 18, 31 and 13 joints). (G) Number of ligament and tendon GFP+ cells in 4 and 5 dpf control and anaesthetised zebrafish at the jaw joint. (n=15, 18, 31 and 13 joints). Kruskal–Wallis tests were carried out for statistical analysis in C′,D′,G and one-way ANOVA in F. ns, not significant, *P≤0.05, ***P≤0.001. Data are mean and 95% confidence interval.
|
