
Fig. 1
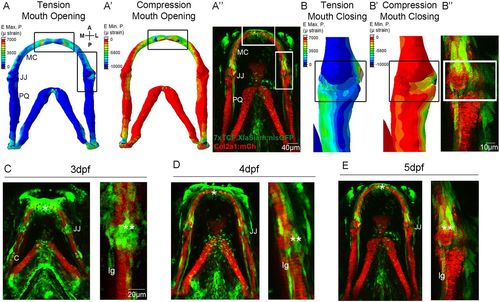
Patterns of biomechanical strain and the location of Wnt-responsive cells at the zebrafish lower jaw between 3 and 5 dpf. (A,A′) Finite element (FE) model of maximum (E max. P., tension, A) and minimum (E min. P., compression, A′) principal strain on the zebrafish lower jaw during mouth opening at 5 dpf. (B,B′) FE model of maximum (E max. P., tension, B) and minimum (E min. P., compression, B′) principal strain on the jaw joint during mouth closure at 5 dpf. Colour key represents strain in microstrain (µstrain units). (A″,B″,C-E) Tg(7xTCF.XlaSiam:nlsGFP) and Tg(Col2a1aBAC:mcherry) transgenic zebrafish lines with, respectively, the Wnt-responsive cells (green) and cartilage (red) of the lower jaw labelled at 3 (C), 4 (D) and 5 dpf (A″,B″,E). (C-E) Left: lower jaw. Right and B″: jaw joint. (A,A′,B,B′) Reproduced fromBrunt et al. (2015), where it was published under a CC-BY license (https://creativecommons.org/licenses/by/4.0/). A, anterior; P, posterior; M, medial; L, lateral; MC, Meckel's cartilage; JJ, jaw joint; PQ, palatoquadrate; C, cartilage; lg, ligament; *anterior MC; **jaw joint. Scale bars: 40 μm in A″; 10 μm in B″; 20 μm in C-E. |