
Fig. 4
- ID
- ZDB-FIG-170620-6
- Publication
- Miller et al., 2017 - A genetic basis for molecular asymmetry at vertebrate electrical synapses
- Other Figures
- All Figure Page
- Back to All Figure Page
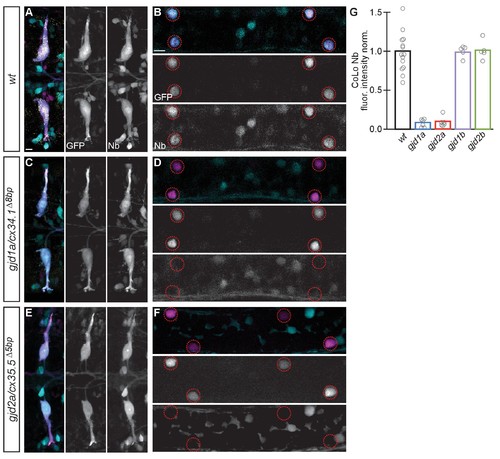
Electrical synapses are functionally defective in gjd1a/cx34.1 and gjd2a/cx35.5 mutants. Retrograde labeling of Mauthner axons with the gap junction permeable dye Neurobiotin (Nb) from a caudal transection. Hindbrain and spinal cord images are maximum intensity projections of ~30 and~10 uM, respectively. Anterior is to the left. Scale bar = 10 uM. Spinal cord images are at the level of the CoLo cell bodies (circles), which is dorsal to the synapses. (A–F) Larvae are stained for anti-GFP (magenta), biotin (Nb, cyan), and anti-human-Connexin36 (Cx36, yellow). Nb labels the Mauthner cell bodies and other caudally projecting neurons in the hindbrain (A) and passes from the Mauthner axon through the electrical synapses to fill the CoLo cell bodies (B), circles). Other neurons are also labeled due to projections caudally into the lesion site (A, non-Mauthner neurons, B, non-circled cell bodies). (C–F) In gjd1a/cx34.1 and gjd2a/cx35.5 mutants Nb labels M normally (C,E) however none passes into CoLos (D,F). (G) Quantitation of the ratio of Nb in CoLo to M cell bodies in wildtype and mutants. Each circle represents the average Nb fluorescence within 8–12 CoLo cell bodies compared to the 2 Mauthner cell bodies in an animal. Associated experimental statistics are found in the figure-related table. Associated quantitation of Nb transfer in wildtype or mutant can be found in source data for Figure 4. |
| Fish: | |
|---|---|
| Observed In: | |
| Stage: | Day 5 |