
Fig. 8
- ID
- ZDB-FIG-170620-10
- Publication
- Miller et al., 2017 - A genetic basis for molecular asymmetry at vertebrate electrical synapses
- Other Figures
- All Figure Page
- Back to All Figure Page
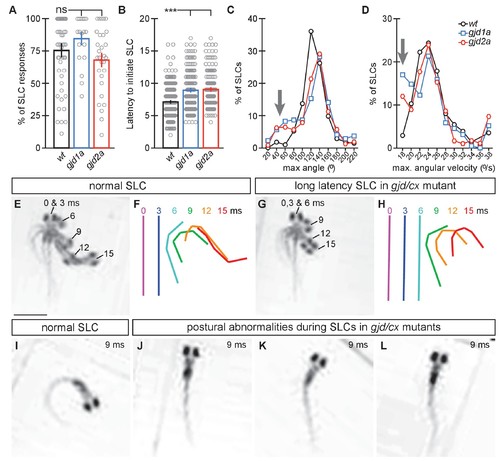
gjd1a/cx34.1 and gjd2a/cx35.5 mutants have delayed and abnormal escape responses. M-induced escape responses (Short Latency C-bends, SLCs) to a startling vibrational (sound) stimuli executed by 6 day post fertilization larvae were analyzed by high-speed (1000 frame per second) videomicroscopy. Scale bar = 1 mM. (A) Frequency of elicited SLCs in wildtype (wt) and indicated mutants in 10 trials per animal. Note that the FLOTE analysis software removes some trials if they cannot be classified. Bar graphs represent data as mean ± SEM with each circle representing an individual animal’s average % of response. Mutant larvae execute escapes as frequently as WT (n = 52, 20, and 29 larvae for wt, gjd1a/cx34.1, and gjd2a/cx35.5, respectively; 1 way ANOVA not significant (ns), Dunn’s Multiple Comparison Test: wt to gjd1a/cx34.1 and wt to gjd2a/cx35.5 both ns). (B) Latency of elicited SLCs in all individual trials. Bar graphs represent data as mean ± SEM with each circle representing individual SLC latencies. Mutant larvae are significantly delayed in their latency to initiate an M-induced SLC (n = 359, 160, and 180 SLCs from 52, 20, and 29 larvae from wt, gjd1a/cx34.1, and gjd2a/cx35.5, respectively; 1 way ANOVA p<0.0001, Dunn’s Multiple Comparison Test: wt to gjd1a/cx34.1 and wt to gjd2a/cx35.5 both significant at p<0.001). (C,D). Kinematic analysis of the maximum SLC turn angle (C) and angular velocity (D) plotted as the average number of events within an indicated bin. Arrows indicate shallow angle and low velocity turns exhibited by mutants. (E–H) Time-lapse analysis of a normal (E,F) and delayed (G,H) M-induced escape response (SLCs). Individual snapshots taken at the indicated times (ms = milliseconds) are overlaid on an individual image (E,G). A line representing the midline body axis at each time was drawn by hand to indicate the movement (F,H). (I–L) A normal escape bend at its maximum angle (I) compared to abnormally shaped escape bends executed by gjd1a (J,K) or gjd2a (L) mutant larvae. Associated experimental statistics can be found in source data for Figure 8. |
| Fish: | |
|---|---|
| Observed In: | |
| Stage: | Day 6 |