
Fig. 7 S2
- ID
- ZDB-FIG-170609-32
- Publication
- Venero Galanternik et al., 2017 - A novel perivascular cell population in the zebrafish brain
- Other Figures
- All Figure Page
- Back to All Figure Page
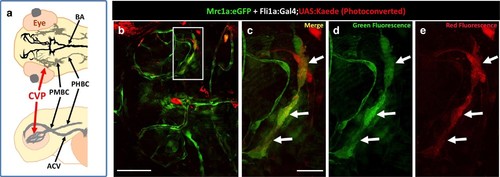
Zebrafish FGPs emerge from the endothelium of the choroidal vascular plexus. (a) Dorsal (top) and lateral (bottom) view schematic diagrams of approximately 2.5 dpf zebrafish heads with some of their associated vasculature, especially major venous tracts. OCVP, choroidal (optic choroidal) vascular plexus; PMBC, primordial midbrain channel; PHBC, primordial hindbrain channel; BA, basilar artery. Adapted from Figure 5B, The Vascular Anatomy of Zebrafish Atlas (Isogai et al., 2001) – see this reference for additional details. (b) Photoconversion on the OCVP results in red Kaede Mrc1a:eGFP-positive cells. Dorsal view of a 5 dpf Tg(fli:gal4);Tg(UAS:Kaede);Tg(mrc1a:eGFP) triple-transgenic (b) showing FGPs on the optic tectum (box), (n = 9/19 embryos showed Red Kaede, with 1.37 ± 1.98 S.D. red FGPs per tectal neuropile). (c–e) Higher magnification views of the box in panel b showing Mrc1a:eGFP (green) and photoconverted Kaede (red) double positive FGPs (white arrows). Green fluorescence is shown in panels c and d, red fluorescence is shown in panels c and e. Rostral is to the left in all panels. Scale bars: 200 μm (b); 50 μm (b’–d). |