
Fig. S5
- ID
- ZDB-FIG-170530-19
- Publication
- Wan et al., 2017 - Opposing Actions of Fgf8a on Notch Signaling Distinguish Two Muller Glial Cell Populations that Contribute to Retina Growth and Regeneration
- Other Figures
- All Figure Page
- Back to All Figure Page
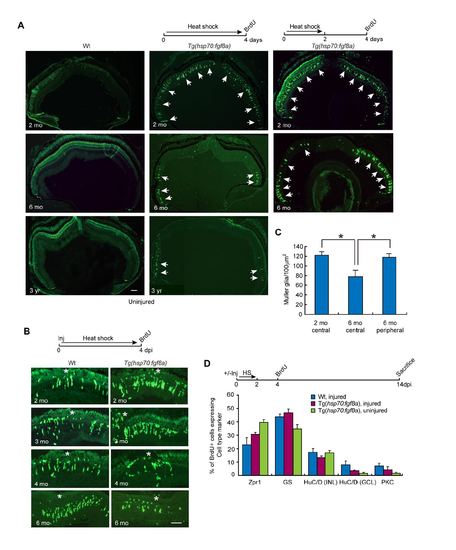
Related to Figure 5. Age-dependent change in Fgf8a signaling. (A) BrdU immunofluorescence in uninjured retinas from Wt and hsp70:fgf8a fish at different ages that received HS for 2 or 4 days. Arrows point to BrdU+ MG; scale bar is 150 µm. (B) BrdU immunofluorescence in injured retinas from Wt and hsp70:fgf8a fish at different ages that received HS for 4 days. Asterisk indicates injury site; scale bar is 100 µm. (C) Glutamine synthetase immunofluorescence was used to quantify MG in the central and peripheral regions of 2 mo and 6 mo old fish retinas; n=3 individual experiments, error bars are s. d. *P<0.05. (D) BrdU-based lineage tracing strategy was used to follow the fate of MG-derived progenitors in injured retinas from Wt fish and uninjured and injured retinas from hsp70:fgf8a fish that received a 2 day HS treatment at the time of injury; n=3 individual experiments, error bars are s. d. Antibodies used are: anti-Zpr1, cones; anti-GS, Muller glia; anti-HuC/D, amacrine cells in INL (inner nuclear layer) and ganglion cells in GCL (ganglion cell layer); anti-PKC, bipolar cells. |