
Fig. S2
- ID
- ZDB-FIG-170530-16
- Publication
- Wan et al., 2017 - Opposing Actions of Fgf8a on Notch Signaling Distinguish Two Muller Glial Cell Populations that Contribute to Retina Growth and Regeneration
- Other Figures
- All Figure Page
- Back to All Figure Page
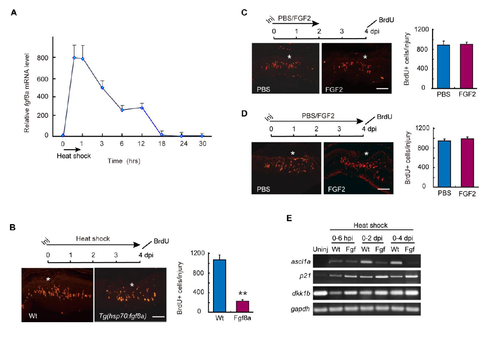
Related to Figure 2. Fgf8a inhibits MG proliferation. (A) qPCR analysis of fgf8a expression at various times after a 1 hr HS in hsp70:fgf8a fish. (B) BrdU immunofluorescence in injured retinas from Wt and hsp70:fgf8a fish that received HS for 4 days; asterisk indicates injury site (central retina, 6 mo old fish); scale bar is 100 µm. Graph is quantification of BrdU+ cells/injury. Asterisk indicates injury site; n=3 individual experiments, error bars are s. d. **P<0.01. (C, D) BrdU immunofluorescence in injured retinas from Wt fish that received daily intravitreal injections of PBS/FGF2 2 days (C) or 4 days (D); Asterisk indicates injury site (central retina, 6 mo old fish); scale bar is 100 µm; Graphs show quantification of BrdU+ cells/injury; n=3 individual experiments, error bars are s. d. (E) RT-PCR analysis of indicated genes in uninjured and injured retinas from Wt and hsp70:fgf8a (Fgf) fish that received HS for the indicated times. |