
Fig. 5
- ID
- ZDB-FIG-170523-22
- Publication
- Lopez et al., 2017 - A152T tau allele causes neurodegeneration that can be ameliorated in a zebrafish model by autophagy induction
- Other Figures
- All Figure Page
- Back to All Figure Page
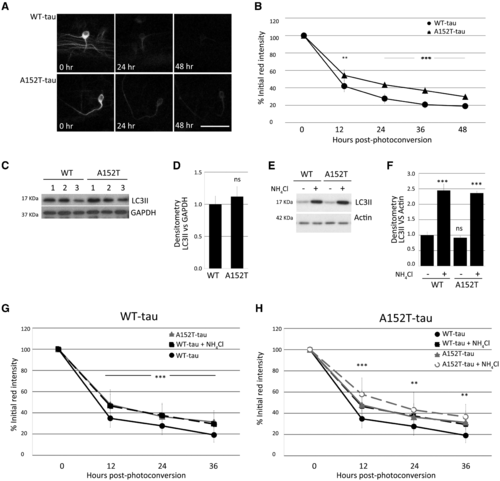
Tau clearance in vivo and autophagy function. Clearance kinetics of photoconverted Dendra-tau measured in neurons of WT-tau and AT152T-tau fish. Measurement of the intensity of the red Dendra-tau signal over time reflects the clearance or degradation of tau protein. (A) Representative images of photoconverted red Dendra-tau signal comparing a single neuron from WT-tau and A152T-tau fish at three different timepoints: immediately after photoconversion (0 h), 24 h and 48 h after photoconversion. (B) Quantification of red Dendra-tau intensity in photoconverted neurons in the spinal cord of WT-tau and A152T-Tau transgenic fish (representative images shown in Supplementary Fig. 8C). The percentage of residual photoconverted red Dendra-tau was measured over 48 h measured at 12-h intervals. Dendra-tagged A152T-tau clears at a significantly lower rate than WT-tau. (n = 30/group shown as mean ± SD; Student-Newman-Keuls one-way ANOVA, **P < 0.01 and ***P < 0.001 versus WT-tau). (C–F) Western blots for LC3-II, a well-characterized marker of autophagosome number, demonstrate that there are no differences in the levels of this protein between WT-tau and A152T-tau fish either at 24 hpf (pre-phenotype; C and D) or 72 hpf (post-phenotype; E and F). (E and F) Measurements of LC3-II levels in the presence or absence of ammonium chloride provides a method for measuring autophagic flux. No differences were observed between the two transgenic lines at 3 dpf, suggesting that autophagy functions normally in both WT-tau and A152T-tau fish (graph represents mean ± SD of four independent clutches per group for E and F and three for C and D; two-tailed t-test). (G and H) Clearance kinetics of Dendra-tau was measured in the presence or absence of ammonium chloride. Treatment with ammonium chloride blocks autophagic flux and delays the clearance of both WT-tau and A152T-tau to the same extent, indicating that flux occurs at the same rate in these two lines (mean ± SD, n = 62 neurons/group; Student-Newman-Keuls one-way ANOVA, **P < 0.01 and ***P < 0.001 versus untreated group). Note in G and H, the ‘WT-tau + NH4Cl’ (denoted by black squares and black dashed line) overlaps with the ‘A152T-tau’ line (denoted by grey triangles and grey solid line). The graphs in G and H are presented with a different line in the foreground and background to aid interpretation. |