
Fig. S6
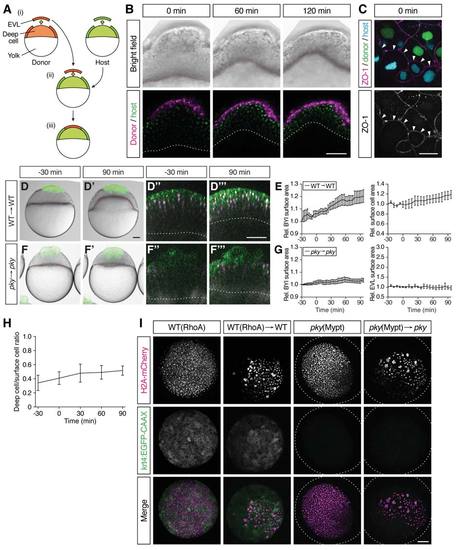
Characterization of Embryo Shapes and Surface Cell Differentiation in the Transplantation Experiments, Related to Figure 5 (A) Schematic of the procedure of EVL/surface cell transplantations. Donor and host embryos are labeled with fluorescent proteins or dyes of different color. ≈ 70 EVL/surface cells are taken from the donor embryo and nearly the same number of EVL/surface cells was removed from the host embryo (i); donor EVL/surface cells are placed on the surface-cell free area of the host embryo (ii and iii). (B) Bright-field (upper row) and confocal microscopy images (bottom row) of a WT embryo containing transplanted cells from a WT donor embryo at the onset (0 min), middle (60 min) and end of doming (120 min). There are only very few deep cells from the donor embryo compared with the number of transplanted EVL cells. The plasma membrane and nuclei of the transplanted EVL cells are marked by mem-RFP (magenta) and H2A-mCherry (magenta), respectively. The plasma membrane and nuclei of the host cells were marked with mem-GFP (green) and H2B-GFP (green), respectively. Red and white dotted lines, BYI. Scale bar, 100 μm. (C) Tight junction formation, marked by the localization of the tight junction component ZO-1, between transplanted WT donor cells and pky mutant host cells (n embryos = 11). ZO-1 (white) is localized to the interface between donor (green nuclei; WT) and host cells (cyan nuclei; pky) indicative of tight junction formation at the interface between these cells. Scale bar, 20 μm. (D-G) Embryos where EVL/surface cells were transplanted from WT to WT embryos (D-E) (n embryos = 3) and from pky to pky embryos (F-G) (n embryos = 3). Bright-field images of mosaic embryos before (-30 min) and after completion of doming (+90 min) with transplanted cells marked by fluorescent dextran (green; D, D', F and F'). Confocal images with plasma membrane expressing mem-GFP (green), nuclei marked by H2AmCherry (magenta) and BYI outlined by fluorescent dextran (white; D'', D''', F'' and F'''). Transplanted cells were marked by fluorescent dextran (green; D, D', F and F') or H2B-GFP (green; D'', D''', F'' and F'''). Red and white dashed lines, BYI. Changes in relative BYI area (left column) and relative EVL/surface cell area (right column) as a function of time during doming in the different transplantation experiments (E and G). Error bars, ± s.e.m. Scale bars, 100 μm. (H) Ratio of deep-to-surface cells for transplanted RhoA-overexpressing cells as a function of time during doming (n embryos = 4). t = 0 min corresponds to the onset of doming. Error bars, ± s.e.m. (I) EVL differentiation in RhoA- or Mypt1-overexpressing embryos. RhoA-overexpressing WT EVL cells in intact (top row) and transplanted (second row from top) embryos expressing the EVL-differentiation marker krt4:EGFP-CAAX. Mypt1-overexpressing pky cells in intact (third row from top) and transplanted embryos (bottom row) do not show krt4:EGFP-CAAX expression. H2A-mCherry mRNA was co-injected with RhoA or mypt1 mRNA into one-cell stage embryo to mark the injected cells. Dotted lines, embryo outline. Scale bar, 100 μm. |
Reprinted from Developmental Cell, 40(4), Morita, H., Grigolon, S., Bock, M., Krens, S.F., Salbreux, G., Heisenberg, C.P., The Physical Basis of Coordinated Tissue Spreading in Zebrafish Gastrulation, 354-366.e4, Copyright (2017) with permission from Elsevier. Full text @ Dev. Cell