
Fig. 2
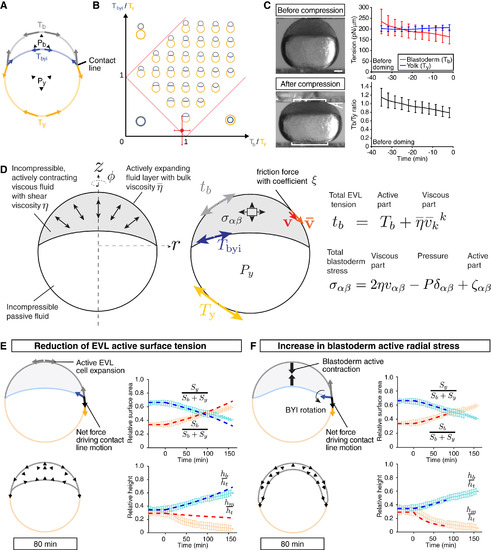
Physical Description of Doming Based on Changes in Blastoderm Surface Tension and Radial Stress (A) Schematic of the surface tension model for describing embryo shapes at the onset of doming. The ratio of volumes of blastoderm and yolk is fixed, and the blastoderm, yolk, and BYI interfaces are subjected to surface tensions. (B) Phase diagram of equilibrium shapes predicted by the surface tension model of the embryo as a function of the surface tension ratios Tb/Ty and Tbyi/Ty. Red dot, predicted ratio of surface tensions before doming from analysis of embryo shape. (C) Measurement of blastoderm (Tb) and yolk cell surface tension (Ty) in WT embryos at the onset of doming using tissue tensiometry. Embryos were compressed by 20% of their initial uncompressed height. Panels on the left are bright-field images of a WT embryo before (top) and after compression (bottom). Brackets, contact areas. Kinked line, contact angle. Panels on the right show Tb and Ty (top) and Tb/Ty (bottom) as a function of time after compression. n = 4 embryos. Error bars, ±SD. Scale bar, 100 μm. (D) Schematic of the dynamic model of doming. The blastoderm is represented by an incompressible viscous fluid with shear viscosity η, subjected to an anisotropic, radially oriented active internal stress with magnitude ζ. The EVL is represented by a compressible fluid with bulk surface viscosity (E and F) Two hypothetical scenarios for doming where either EVL surface tension reduction results in an imbalance of forces at the contact line, driving EVL surface expansion (E) or active radial contraction of the deep cell layer drives blastoderm thinning (F). In (F) blastoderm deformation leads to a rotation of the BYI tangent vector at the contact line, resulting in a net force at the contact line driving EVL surface expansion. Left panels in (E) and (F) are schematic representations of the different mechanisms on which the simulations are based on and the simulated embryos shapes at 80 min of doming. Black arrows outline blastoderm velocity field. Right panels in (E) and (F) are plots of embryo surface area and height as a function of time during doming with pale blue and red curves showing the experimental measurements, and dashed red and blue thick lines showing simulation results. Simulations parameters are specified in Table S1C. Simulations in (F) were stopped when the angle between the EVL and the YSL approached a zero value. Error bars, ±SD. See also Figure S2 and Movie S2. |
Reprinted from Developmental Cell, 40(4), Morita, H., Grigolon, S., Bock, M., Krens, S.F., Salbreux, G., Heisenberg, C.P., The Physical Basis of Coordinated Tissue Spreading in Zebrafish Gastrulation, 354-366.e4, Copyright (2017) with permission from Elsevier. Full text @ Dev. Cell