
Fig. S3
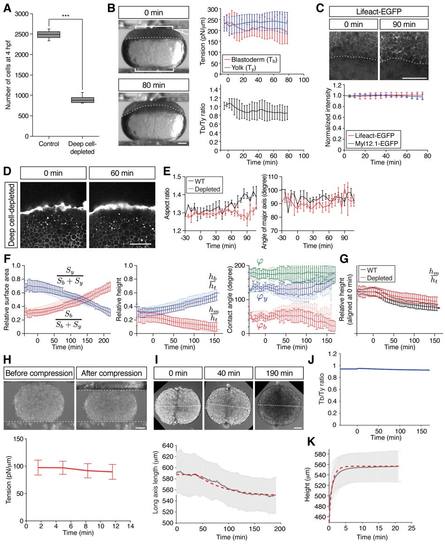
Characterization of Deep Cell-Depleted Embryos and Tissue Explants, Related to Figure 4 (A) Number of deep cells in WT control and deep cell-depleted embryos. Confocal images of sphere stage (4 hpf) embryos with nuclei marked by H2A-mCherry expression at the center of the embryo (400×400×300 μm volume) were used to count deep cells. Box plots represent 5%, 25%, median, 75% and 95%. ***P < 0.001 (t-test). n embryos = 3 (control) and 5 (deep cell-depleted). (B) Measurement of blastoderm (Tb) and yolk cell surface tension (Ty) in deep cell-depleted WT embryos during the course of doming using tissue tensiometry. Embryos were compressed by 20% of their initial uncompressed height. Panels on the left are bright-field images of a deep cell-depleted embryo before (0 min; top) and after doming (+80 min; bottom). Brackets, contact areas. Kinked line, contact angle. Dashed lines, BYI. Panels on the right show quantification of Tb (top, red line) and Ty (top, blue line) and Tb/Ty (bottom, black line) as a function of time after compression. n embryos = 7. Error bars, ± s.d. Scale bar, 100 μm. (C) Actin and myosin II localization at the BYI. Two-photon microscopy sections of the BYI region at ~100 μm depth from the surface of a Tg(actb1:Lifeact-EGFP) embryo at the onset (upper left) and end (upper right) of doming. Animal pole is up. EGFP signal intensity within a ~100 μm region of the YSL below the BYI of Tg(actb1:Lifeact-EGFP) (red line) and Tg(actb1:Myl12.1-EGFP) (blue line) embryos were quantified during doming and normalized by the signal intensity at 0 min (bottom). n embryos = 12 (Lifeact-EGFP) and 6 (Myl12.1-EGFP). Dotted lines, BYI. Error bars, ± s.d. Scale bar, 100 μm. (D) Yolk granule shape in deep cell-depleted WT embryos. Single plane confocal images of yolk granules in a deep cell-depleted embryo injected with fluorescent dextran into the yolk at 0 min (left) and +60 min (right) of doming. Scale bar, 100 μm. (E) Quantification of yolk granule aspect ratio (left) and angle of major axis (right) from -30 to +108 min of doming in intact WT (black) and deep cell-depleted embryos. n embryos = 4 (intact) and 6 (deep celldepleted). Error bars, ± s.e.m. (F) Comparison of WT control with deep cell-depleted embryo shapes (surface area, height and contact angles) during doming. Pale red and blue lines show WT control embryos, and dark red and blue lines deep cell-depleted embryos. n embryos = 6 (control) and 5 (deep cell-depleted). Error bars, ± s.d. (G) Comparison of relative blastoderm height in WT (black line) and deep cell-depleted (red line) embryos during doming. The relative height data were taken from the middle panel of Figure S3F (hm/ht) and aligned at the onset of doming (0 min) to better illustrate subsequent changes between WT and deep cell-depleted embryos during the course of doming. Error bars, ± s.d. (H) Measurement of surface tension of blastoderm explants. Fused blastoderm explants were compressed by 20% of their initial uncompressed height. Upper panels show the explant before (upper left) and after (upper right) compression. Dotted lines, surface position of the upper and lower plates. Lower panel is the quantification of the surface tension of the explants. t = 0 min corresponds to the onset of doming in unperturbed control embryos. n = 4. Error bars, ± s.d. Scale bar, 100 μm. (I) Fusion of blastoderm explants. Two blastoderm explants consisting of EVL and deep cells were removed from 1k-cell stage embryos (3 hpf) and put into contact with each other. Changes in the length of the longest axis of the fused explants were monitored as a function of time during fusion. Upper panels are still images from a time-lapse movie of fusing explants. Dotted lines, measured long axis length. Lower panel shows the quantification of the long axis length, in which pale grey lines show experimental results, while dashed thick red lines show the outcome of simulations of this process using a sphere relaxing to its equilibrium shape after equatorial deformation as a proxy for the fusion process (see also Methods S1). The first ~ 40 min have not been taken into account in the fitting procedure in order to avoid artifacts due to wound healing at early stages of explant fusion. The values of the viscosities of deep cell layer and EVL used for the simulation are specified in Table S1C. t = 0 min corresponds to about 20-30 min later after the onset of fusion. n explants = 9. Error bars, ± s.d. Scale bar, 100 μm. (J) Calculated ratio of blastoderm to yolk total surface tension in simulations of deep-cell depleted embryos. (K) Experimental measurements and simulations of yolk cell relaxation after compression to determine yolk cell viscosity. Yolk explants were obtained from embryos at the 256- and 512-cell stages (2.5 - 2.75 hpf) and compressed when unperturbed control embryos had reached the onset of doming. After 30 min of compression, the upper plate was removed and the relaxation of the yolk explant height was measured. Pale gray line represents the experimental results and red dashed line shows the outcome of the simulations of this process. The value of yolk cell viscosity used to fit the simulations to the experimental results = 40 Pa s. n explants = 17. Error bars, ± s.d. |
Reprinted from Developmental Cell, 40(4), Morita, H., Grigolon, S., Bock, M., Krens, S.F., Salbreux, G., Heisenberg, C.P., The Physical Basis of Coordinated Tissue Spreading in Zebrafish Gastrulation, 354-366.e4, Copyright (2017) with permission from Elsevier. Full text @ Dev. Cell