
Fig. S2
- ID
- ZDB-FIG-170125-31
- Publication
- Willis et al., 2016 - Injections of Predatory Bacteria Work Alongside Host Immune Cells to Treat Shigella Infection in Zebrafish Larvae
- Other Figures
- All Figure Page
- Back to All Figure Page
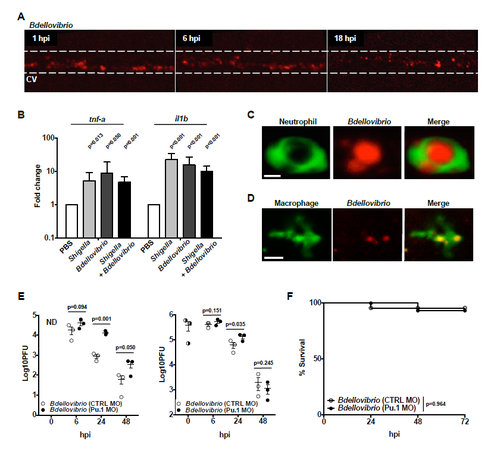
Characterisation of the Innate Immune Response to Bdellovibrio In Vivo, Related to Figure 3 (A) 1-2 x 10⁵ PFU of mCherry-Bdellovibrio (red) were injected into the caudal vein of WT AB zebrafish larvae at 3 dpf and imaged at the stereomicroscope. The same larva was imaged over time. The area inside the white dashed line indicates the blood stream. CV, caudal vein. (B) WT zebrafish larvae were injected with: PBS, >5 x 10³ CFU of S. flexneri, 1-2 x10⁵ PFU of Bdellovibrio or co-injected with the above doses of S. flexneri and Bdellovibrio, sequentially. RNA was extracted from pools of 5 larvae and (2 technical replicates for each of 3 biological repeats for tnf-a, 2 technical replicates for each of 4 biological repeats for il1b; normalised to PBS). Expression of il1b and tnf-a mRNA transcripts was determined by qRT-PCR. p values (versus PBS control) determined by unpaired 1-tailed Student’s t-test. Significance defined as p<0.05. (C) 1-2 x 10⁵ PFU of mCherry-Bdellovibrio were injected into the tail muscle of Tg(mpx:GFP)i114 zebrafish larvae at 3 dpf and single-cell interactions between Bdellovibrio (red) and neutrophils (green) visualised by high-resolution confocal microscopy at 100x magnification. A representative image is shown. Scale bar = 5 μm. See also Movie S4. (D) 1-2 x 10⁵ PFU of mTeal-Bdellovibrio were injected into the tail muscle of Tg(mpeg1:Gal4-FF)gl25/Tg(UAS-E1b:nfsB.mCherry)c264 zebrafish larvae at 3 dpf and single-cell interactions between Bdellovibrio (red) and macrophages (green) visualised by high-resolution confocal microscopy at 63x magnification. A representative image is shown. Scale bar = 10 μm. See also Movie S4. (E) Tg(mpx:GFP)i114 zebrafish larvae were pre-treated using control (CTRL) or Pu.1- targeting morpholino (MO) to deplete leukocytes. Morphants were injected at 3 dpf with either PBS or 0.1-6 x 10⁵ PFU of mCherry-Bdellovibrio. Live Bdellovibrio were enumerated from PBS homogenates of larvae. Each circle represents a count from an individual larva. Half-filled circles represent enumerations from larvae at time 0 and are representative of inocula for both conditions. Mean ± SEM (horizontal bars) are shown. p values (between conditions at cognate timepoints) determined by multiple t-test. Significance with Bonferroni correction defined as p<0.017. As inocula from independent experiments were variable up to a log-fold (PFU counting of predators necessarily performed post experiment), representatives of 3 independent experiments performed are shown. See also Figure 3E. (F) Survival curve of Tg(mpx:GFP)i114 zebrafish larvae injected with control (CTRL) or Pu.1-targeting morpholino (MO) and then injected at 3 dpf with either PBS or 1-2 x 10⁵ PFU of mCherry-Bdellovibrio. Larvae were incubated at 28°C for 72 hpi. Data pooled from 2 independent experiments using n = 21-26 larvae per treatment per experiment. Up to 3 larvae per condition were taken for CFU at 24 and 48 hr timepoints. Mean ± SEM (horizontal bars) are shown. p value between conditions determined by log rank Mantel-Cox test. Significance defined as p<0.05. |