
Fig. 2
- ID
- ZDB-FIG-170125-28
- Publication
- Willis et al., 2016 - Injections of Predatory Bacteria Work Alongside Host Immune Cells to Treat Shigella Infection in Zebrafish Larvae
- Other Figures
- All Figure Page
- Back to All Figure Page
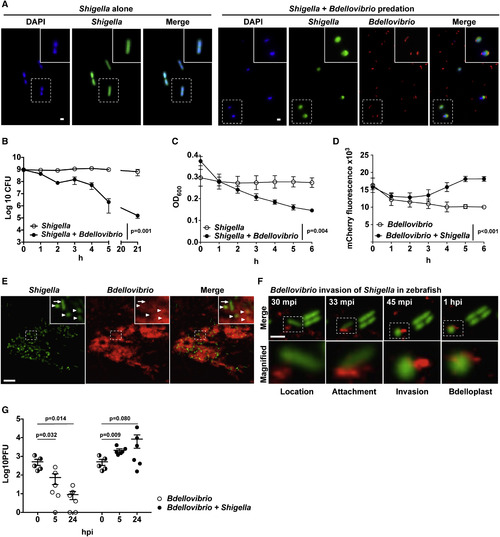
Bdellovibrio Prey on Shigella In Vitro and In Vivo inside Living Zebrafish (A) GFP-S. flexneri (green) were incubated in vitro, in the presence or absence of mCherry-Bdellovibrio (red), and visualized by wide-field fluorescent microscopy. Representative images, including rod-shaped Shigella and rounded Shigella invaded by smaller comma-shaped Bdellovibrio, were taken at 1 hr post-mixing. Scale bar, 1 μm. (B) 5–12 × 108 CFUs of GFP-S. flexneri were incubated, in vitro, in 10 mL CaHEPES buffer for 21 hr in the presence or absence of ∼6.2 × 10¹⁰ PFUs of mCherry-Bdellovibrio. Live Shigella were enumerated over time. Data are pooled from three independent experiments. Mean ± SEM (horizontal bars) is shown. The p value between conditions was determined by paired one-tailed Student’s t test. Significance was defined as p < 0.05. (C and D) 2–7 × 10⁷ CFUs of GFP-S. flexneri, 8.4–10.4 × 10⁹ PFUs of mCherry-Bdellovibrio, or both GFP-S. flexneri and mCherry-Bdellovibrio were incubated in vitro in CaHEPES buffer at 37°C. (C) Optical density 600 (OD600) representing Shigella numbers (Bdellovibrio are too small to contribute to OD600) or (D) mCherry fluorescence intensity representing Bdellovibrio numbers was measured every 30 min for 6 hr using a microplate reader (results plotted every 1 hr). Mean ± SEM from three biological replicates with three technical replicates each is shown. The p value between conditions was determined by paired one-tailed Student’s t test. Significance was defined as p < 0.05. (E) WT AB zebrafish larvae were injected at 3 dpf in the tail muscle with 103 CFUs of GFP-S. flexneri (green) followed by a tail muscle injection of 1–2 × 10⁵ PFUs of mCherry-Bdellovibrio (red) 30–90 min after the initial Shigella infection. Larvae were imaged by confocal microscopy at 20× magnification. Representative images show the different morphologies of Shigella in vivo, including the typical rod-shaped Shigella (arrow) and also a high proportion of rounded Shigella (arrowheads) at regions of interaction with Bdellovibrio. Scale bar, 10 μm. (F) Representative images of predation of Shigella by Bdellovibrio in vivo, inside a larva injected as in (E) and imaged by high-resolution confocal microscopy at 63× magnification. Frames captured over time show stages of Bdellovibrio (red) invasive predation and rounding of Shigella (green) in vivo. Scale bar, 2.5 μm. mpi, minutes post-infection. See also Movie S2. (G) WT AB zebrafish larvae were injected in the hindbrain ventricle at 3 dpf with 2–6 × 10⁵ CFUs of GFP-S. flexneri (green) alone or followed by a hindbrain injection of 1–30 × 102 PFUs of mCherry-Bdellovibrio (red) 30–90 min after the initial Shigella infection. Bdellovibrio were diluted 100-fold from usual injections to facilitate enumeration of any replicated predators. Enumeration of live Bdellovibrio in PBS-treated homogenates of larvae over time is shown. Each circle represents a count from an individual larva. Half-filled circles represent enumerations from larvae at time 0 and are representative of inocula for both conditions. Only viable larvae were included in the analysis. Data are pooled from two independent experiments (up to n = 3 larvae per time point per experiment). Mean ± SEM (horizontal bars) is shown. The p values (versus the 0 hpi time point) were determined by multiple t test. Significance with Bonferroni correction was defined as p < 0.0125. Of note, p values (not displayed on figure) between conditions at cognate time points were determined by unpaired one-tailed Student’s t test with significance defined as p < 0.05. These are as follows: p < 0.001 between conditions at 5 hr and p < 0.0852 at 24 hr. |