
Fig. 1
- ID
- ZDB-FIG-170117-3
- Publication
- He et al., 2016 - Effect of JNK inhibitor SP600125 on hair cell regeneration in zebrafish (Danio rerio) larvae
- Other Figures
- All Figure Page
- Back to All Figure Page
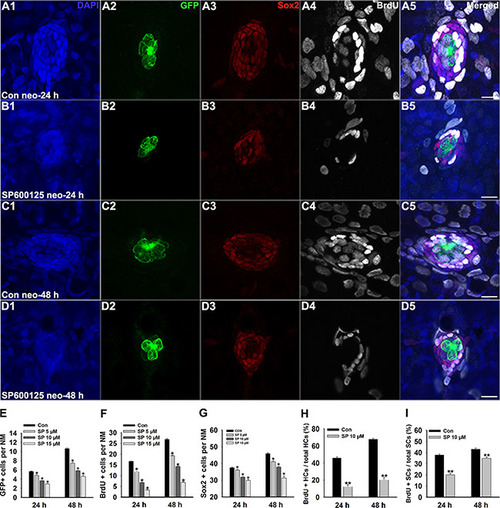
SP600125 decreases regeneration of hair cells in zebrafish lateral line neuromasts. (A–D) We treated 5 dpf Tg(Brn3c:mGFP) zebrafish with 400 μM neomycin for 1 h and then treated them for 24 h or 48 h with 10 μM SP600125 and subsequently imaged GFP-positive hair cells (green), Sox2-positive supporting cells (red), and BrdU-positive replicating cells (white). SP600125 significantly decreased the numbers of GFP-positive hair cells and Sox2-positive supporting cells in neuromasts as well as reduced the proportion of cells in S-phase as indicated by BrdU staining. Scale bars = 10 μm. Higher magnification of hair cells and supporting cells of the neuromast taken from z-stacks show that hair cells and supporting cells in untreated controls and SP600125-treated animals had no observable morphological differences though there were fewer GFP-positive and Sox2-positive cells in the neuromasts of larvae treated with SP600125. (E) Quantification of the number of hair cells in control and SP600125-treated larvae at 24 hours and 48 hours after neomycin incubation. (F) Quantification of replicating cells in control and SP600125-treated larvae at 24 hours and 48 hours after neomycin incubation. (G) Quantification of the number of Sox2-positive cells in control and SP600125-treated larvae at 24 hours and 48 hours after neomycin incubation. In the 24-hour group, n = 100 control neuromasts, n = 40 5 μM SP600125-treated neuromasts, n = 60 10 μM SP600125-treated neuromasts, and n = 32 15 μM SP600125-treated neuromasts. In the 48-hour group, n = 72 control neuromasts, n = 28 5 μM SP600125-treated neuromasts, n = 32 10 μM SP600125-treated neuromasts, and n = 32 15 μM SP600125-treated neuromasts. *p < 0.05. (24-hour group: One-way ANOVA; GFP+ cells: F3, 228 =71.15, p < 0.05; Sox2+ cells: F3, 228 = 38.48, p < 0.05; BrdU+ cells: F3, 228 = 172.5, p < 0.05. 48-hour group: One-way ANOVA; GFP+ cells: F3, 160 = 184.9, p < 0.05; Sox2+ cells: F3, 160 = 90.65, p < 0.05; BrdU+ cells: F3, 160 = 365.5, p < 0.05). Bars are mean ± s.e.m. (H, I) Quantification of the ratio of BrdU-positive hair cells and the ratio of BrdU-positive supporting cells in control and SP600125-treated larvae at 24 hours and 48 hours after neomycin incubation. Bars are mean ± s.e.m. In the 24-hour group, n = 100 control neuromasts and n = 60 10 μM SP600125-treated neuromasts. In the 48-hour group, n = 72 control neuromasts and n = 32 10 μM SP600125-treated neuromasts. **p < 0.001. (24-hour group: BrdU+ HCs: unpaired t test, two-tailed, t = 11.54 , df = 158, p < 0.001; BrdU+ SCs: unpaired t test, two-tailed, t = 10.5, df = 158, p < 0.001. 48-hour group: BrdU+ HCs: unpaired t test, two-tailed, t = 16.74, df = 102, p < 0.001; BrdU+ SCs: unpaired t test, two-tailed, t = 4.922, df = 102, p < 0.001). Bars are mean ± s.e.m. |