
Fig. 1
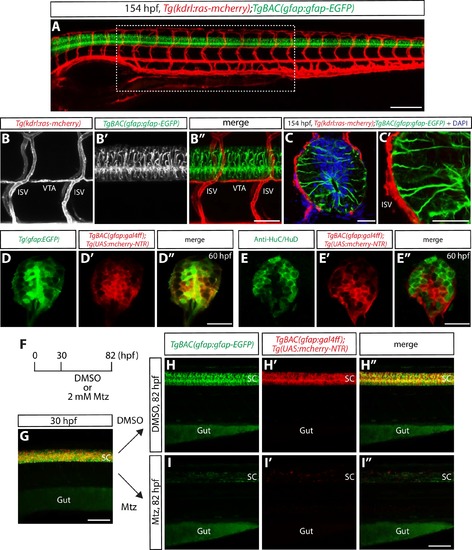
Physical proximity between the end-feet of spinal cord radial glia and extraneural vessels during development. (A) Lateral view of a 154 hpf Tg(kdrl:ras-mcherry);TgBAC(gfap:gfap-EGFP) trunk. The region inside the dashed line corresponds to the 10 somites where all analyses and quantifications were performed. Scale bar, 200 µm. (B–B”) High magnification images of a Tg(kdrl:ras-mcherry);TgBAC(gfap:gfap-EGFP) trunk at 154 hpf. End-feet of radial glia and ISVs or VTAs are physically adjacent. ISVs: intersegmental vessels, VTAs: vertebral arteries. Scale bar, 100 µm. (C–C’) High magnification confocal single-plane images of 154 hpf Tg(kdrl:ras-mcherry);TgBAC(gfap:gfap-EGFP) trunk section counterstained with DAPI. Radial glia end-feet lie in close proximity to ISVs (C’). Scale bars, 20 µm. (D–D”) 60 hpf Tg(gfap:EGFP);TgBAC(gfap:gal4ff);Tg(UAS:mcherry-NTR) trunk spinal cord section. EGFP+ radial glia and mCherry+ cells are largely co-localized. Scale bar, 20 µm. (E–E”) 60 hpf TgBAC(gfap:gal4ff);Tg(UAS:mcherry-NTR) trunk spinal cord section immunostained for HuC/HuD (green). EGFP+ neurons and mCherry+ cells are largely segregated. Scale bar, 20 µm. (F) Time course of nitroreductase (NTR)/metronidazole (Mtz)-mediated cell ablation of radial glia for the panels (G–I”). (G) 30 hpf TgBAC(gfap:gfap-EGFP);TgBAC(gfap:gal4ff);Tg(UAS:mcherry-NTR) trunk. TgBAC(gfap:Gfap-EGFP) expression and TgBAC(gfap:gal4ff);Tg(UAS:mCherry-NTR) expression are observed in the spinal cord in an overlapping manner. SC: spinal cord. Scale bar, 100 µm. (H–H” and I–I”) 82 hpf TgBAC(gfap:gfap-EGFP);TgBAC(gfap:gal4ff);Tg(UAS:mcherry-NTR) trunk after treatment with DMSO (H–H”) or 2 mM Mtz (I–I”) starting at 30 hpf. Unlike DMSO-treated fish that show strong co-expression of TgBAC(gfap:Gfap-EGFP) and TgBAC(gfap:gal4ff);Tg(UAS:mCherry-NTR) in their spinal cord, Mtz-treated fish show a dramatic reduction of this co-expression. Scale bar, 100 µm. |
| Genes: | |
|---|---|
| Antibody: | |
| Fish: | |
| Condition: | |
| Anatomical Terms: | |
| Stage Range: | Prim-15 to Day 6 |
| Fish: | |
|---|---|
| Condition: | |
| Observed In: | |
| Stage: | Protruding-mouth |