
Fig. 3 S1
- ID
- ZDB-FIG-161219-8
- Publication
- Nicolás-Pérez et al., 2016 - Analysis of cellular behavior and cytoskeletal dynamics reveal a constriction mechanism driving optic cup morphogenesis
- Other Figures
- All Figure Page
- Back to All Figure Page
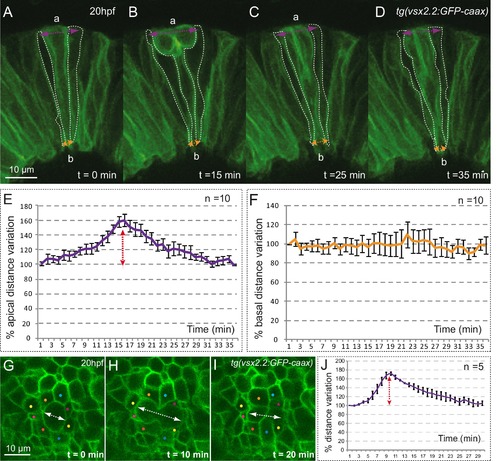
Mitotic rounding impact on basal constriction and apical expansion. (A–D) Confocal microscopy time-lapse images showing a mitosis in a tg(vsx2.2:GFP-caax) retina at 20 hpf. Dashed white lines highlight flanking cells. Arrows indicate apical (purple) and basal (orange) distance variation. The orientation of the apico-basal (a–b) axis is indicated. (E–F) The graphs show the quantification of distance variation (%) for the apical (E) and basal (F) sides. The mitotic event (red arrow) results only in a transient expansion of the apical domain. Error bars indicate standard error of the mean (n = 10, from three different retinas). (G–I) Confocal microscopy time-lapse images showing a mitosis occurring in the apical plane in a tg(vsx2.2:GFP-caax) retina at 20 hpf. Dashed white arrows indicate apical distance variation along the mitotic axis. Neighboring cells are indicated with colored dots. (J) Quantification of apical distance variation (%) along the mitotic axis for five different cells confirms a transient expansion of the apical domain. Scale bars = 10 µm. |