
Fig. 6
- ID
- ZDB-FIG-161219-11
- Publication
- Nicolás-Pérez et al., 2016 - Analysis of cellular behavior and cytoskeletal dynamics reveal a constriction mechanism driving optic cup morphogenesis
- Other Figures
- All Figure Page
- Back to All Figure Page
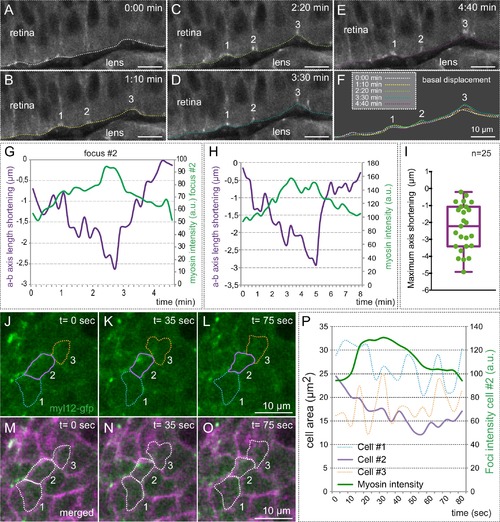
Myosin accumulation correlates with basal membrane displacement. (A–E) Time series of optical sections from tg(actb1:myl12.1-eGFP) embryos show discrete myosin foci (labeled 1, 2, 3) and basal surface displacement. (F) Basal edges were color-coded for each time point and overlapped to illustrate the transient indentations of the basal surface associated to myosin foci. (G–H) Quantitative recording over time of myosin intensity and apico-basal axis shortening for a couple of representative foci. The focus in G is #2 in A–F. (I) Box plot showing the maximum shortening of the a-b axis for 25 foci from 12 different retinas. (J–O) Correlative analysis of basal area (revealed by lyn-tdTomato) and myosin dynamics is shown for three neighbor cells (color-coded). (P) Quantitative analysis of cell area changes and myosin intensity for the three neighboring cells. Note that only the cell accumulating myosin contracts. Scale bars =10 µm. |