
Fig. 8 S1
- ID
- ZDB-FIG-161219-16
- Publication
- Nicolás-Pérez et al., 2016 - Analysis of cellular behavior and cytoskeletal dynamics reveal a constriction mechanism driving optic cup morphogenesis
- Other Figures
- All Figure Page
- Back to All Figure Page
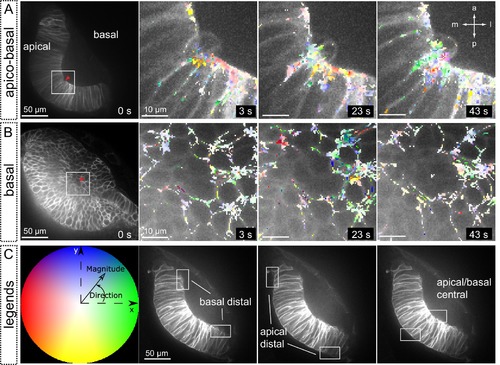
Tissue local relaxation upon laser ablation: Optical flow analysis of tissue displacement. (A–B) Laser ablation experiments at the basal surface of the retina imaged along the apico-basal axis (A) and basal plane (B) Red arrowheads indicate the ablation point. Time 0 corresponds to the first frame after the ablation. Tissue reaction through time is shown at higher magnification (A–B) and particles’ motion is indicated with a color code. (C) Different colors correspond to the direction of the displacement and color intensity to its magnitude. Regions selected for optical flow quantification in Figure 8 are indicated. |