
Fig. 7
- ID
- ZDB-FIG-161201-27
- Publication
- Monroe et al., 2016 - Hearing sensitivity differs between zebrafish lines used in auditory research
- Other Figures
- All Figure Page
- Back to All Figure Page
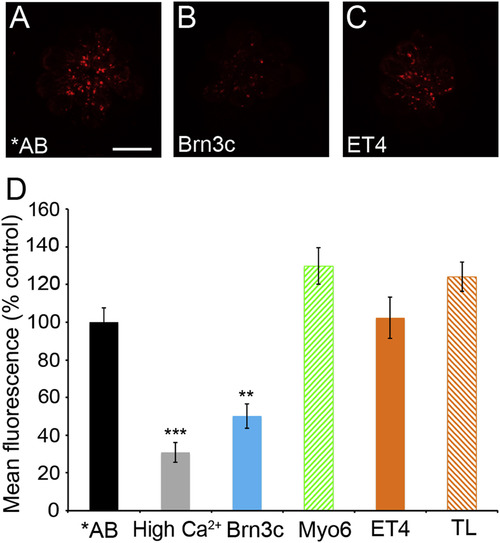
Transgene expression affects mechanotransduction in Brn3c larvae. We used uptake of FM1-43 by hair cells as a proxy for transduction channel function. (A–C) Confocal images of FM1-43 labeling of the MI1 neuromast in (A) *AB fish, (B) Brn3c fish, and (C) ET4 fish. The scale bar in A = 10 μm and applies to all panels. (D) Quantification of mean fluorescence (arbitrary units) in the MI1 neuromast shows a significant effect of genotype/treatment (1-way ANOVA, F5 = 24.72, p < 0.001), due to a significant reduction in FM fluorescence in the high calcium (**p < 0.001) and Brn3c (**p < 0.01) groups (Tukey's multiple comparison test). Data are presented as mean ± S.E., and mean fluorescence is normalized to fluorescence in *AB controls from the same experiment. High extracellular calcium, which reduces the open probability of the transduction channel, was used as a control. N = 10–11 fish per treatment. |
| Fish: | |
|---|---|
| Observed In: | |
| Stage Range: | Day 5 to Day 6 |
Reprinted from Hearing Research, 341, Monroe, J.D., Manning, D.P., Uribe, P.M., Bhandiwad, A., Sisneros, J.A., Smith, M.E., Coffin, A.B., Hearing sensitivity differs between zebrafish lines used in auditory research, 220-231, Copyright (2016) with permission from Elsevier. Full text @ Hear. Res.