
Fig. 4
- ID
- ZDB-FIG-161201-24
- Publication
- Monroe et al., 2016 - Hearing sensitivity differs between zebrafish lines used in auditory research
- Other Figures
- All Figure Page
- Back to All Figure Page
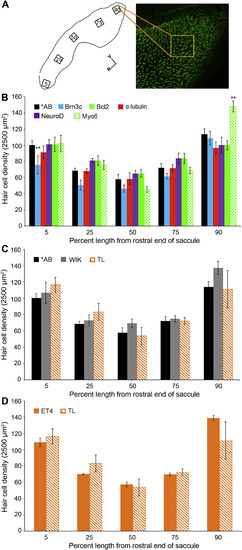
Hair bundle density in the zebrafish saccule. (A) Schematic of the saccular epithelium showing the location of our five sampling regions along the rostral-caudal axis. The confocal image on the right is an example of a phalloidin-labeled saccule. All boxes are 50 × 50 μm and are drawn to scale. V = ventral, R = rostral. (B) Comparison of bundle density in *AB fish and transgenic lines on a *AB background. Hair bundle density significantly differs by genotype and saccular location (2-way ANOVA, F5,225 = 6.88, p < 0.001; and F4,225 = 79.06, p < 0.001, respectively). Bonferroni-corrected posthoc tests were then used to compare each transgenic line to the *AB wildtype fish, where **p < 0.01 indicates significant differences from *AB at that saccular location. (C) There is no significant difference in saccular hair bundle density between wildtype strains (2-way ANOVA, F2,96 = 2.65, p = 0.07). (D) Saccular bundle density does not differ between transgenic ET4 fish and wildtype TL fish (2-way ANOVA, F1,31 = 0.08, p = 0.78). Data are presented as mean ± S.E. N = 4–12 fish per group. |
| Fish: | |
|---|---|
| Observed In: | |
| Stage: | Adult |
Reprinted from Hearing Research, 341, Monroe, J.D., Manning, D.P., Uribe, P.M., Bhandiwad, A., Sisneros, J.A., Smith, M.E., Coffin, A.B., Hearing sensitivity differs between zebrafish lines used in auditory research, 220-231, Copyright (2016) with permission from Elsevier. Full text @ Hear. Res.