
Fig. 2
- ID
- ZDB-FIG-161122-3
- Publication
- Bhattarai et al., 2016 - IL4/STAT6 Signaling Activates Neural Stem Cell Proliferation and Neurogenesis upon Amyloid-β42 Aggregation in Adult Zebrafish Brain
- Other Figures
- All Figure Page
- Back to All Figure Page
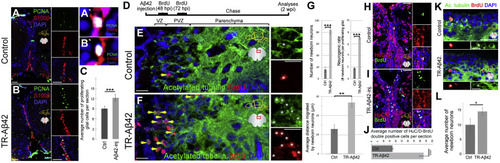
Aβ42 Induces Stem Cell Proliferation and Neurogenesis in Adult Zebrafish Brain (A) PCNA, S100β and DAPI in control brains. Insets: individual channels. (A') High-magnification of a double-positive cell. (B) PCNA, S100β, and DAPI in TR-Aβ42-injected brains. (B') High-magnification of a double positive cell. (C) Quantification for the average number of proliferating glial cells. Ctrl, control; inj, injected. (D) Neurogenesis assay. (E and F) Acetylated tubulin and BrdU in control (E) and TR-Aβ42-injected (F) brains. Insets: single channels. (G) Number and migration distance of newborn neurons. (H and I) HuC/D and BrdU in control (H) and TR-Aβ42-injected brains at 2 weeks post-injection (wpi). (J) Quantification of HuC/D-BrdU double-positive cells. (K) Acetylated tubulin and BrdU in control and TR-Aβ42-injected brains at 3 months after injection. Insets: examples of newborn neurons. (L) Quantification of acetylated tubulin and BrdU double-positive cells per section. Scale bars, 50 μm (A and B) and 20 μm (E, F, H, I, and K). Data are represented as mean ± SD; n = 3 fish. ∗p < 0.05; ∗∗p < 0.01; ∗∗∗p < 0.001. See also Figures S1 and S3 and Table S2. |
| Antibodies: | |
|---|---|
| Fish: | |
| Condition: | |
| Anatomical Terms: | |
| Stage: | Adult |
| Fish: | |
|---|---|
| Condition: | |
| Observed In: | |
| Stage: | Adult |