
Fig. S1
- ID
- ZDB-FIG-161122-7
- Publication
- Bhattarai et al., 2016 - IL4/STAT6 Signaling Activates Neural Stem Cell Proliferation and Neurogenesis upon Amyloid-β42 Aggregation in Adult Zebrafish Brain
- Other Figures
- All Figure Page
- Back to All Figure Page
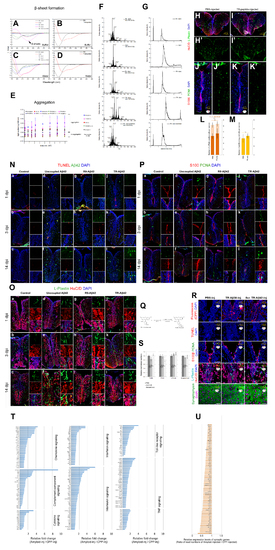
Chemical properties and effects of various amyloid beta peptides and expression changes in inflammation-related and synaptic genes. Related to Figure 1, Figure 2. (A) Circular Dichroism (CD) spectra for uncoupled Aβ42, TR-Aβ42, R9-Aβ42 and scrambled Aβ42 in buffer (PBS). Aβ42 peptides show β-sheet formation in buffer. (B) CD for CPPs alone in buffer. They do not show beta structures. (C) Circular Dichroism (CD) spectra for uncoupled Aβ42, TR-Aβ42, R9-Aβ42 and scrambled Aβ42 in water. Aβ42 peptides do not show β-sheet formation in water. (D) CD for CPPs in water. They do not show beta structures. (E) Light scattering analyses to detect aggregation for R9-Aβ42, TR-Aβ42, Aβ42 scrambled and R9-Aβ38 peptides in water and buffer. Aβ42 peptides aggregate in buffer significantly more than Aβ42 scrambled and Aβ38. No peptide aggregates in water. (F) Mass by charge ratio of the native and modified and amyloid beta peptides. (G) Liquid Chromatography - Mass Spectrometry of HPLC-purified native and modified and amyloid beta peptides. (H) Immunostaining for HuC/D and L-Plastin on PBS-injected brains. (H’) Green channel alone. (I) Immunostaining for HuC/D and L-Plastin on TR peptide-injected brains. (I’) Green channel alone. (J) Immunostaining for S100beta and PCNA on PBS-injected brains. (J’) Green channel alone. (K) Immunostaining for S100b and PCNA on TR peptide-injected brains. (K’) Green channel alone. (L) Quantification graph for L-Plastin cells. TR peptide does not alter the number and activation state of the microglia. (M) Quantification graph for radila glial cell proliferation. TR peptide does not alter the proliferation state of the adult zebrafish brain. (N) TUNEL and Aβ42 staining for control (a-c), uncoupled Aβ42 (d-f), R9-Aβ42 (g-i), TR-Aβ42 (j-l) at 1-, 3- and 14 days post injection (dpi). small insets on the right of every panel are individual fluorescence channels and the composite from a close-up region. (O) L-Plastin and HuC/D staining for control (a-c), uncoupled Aβ42 (d-f), R9-Aβ42 (g-i), TR-Aβ42 (j-l) at 1-, 3- and 14 days post injection (dpi). small insets on the right of every panel are individual fluorescence channels and the composite from a close-up region. (P) S100 and PCNA staining for control (a-c), uncoupled Aβ42 (d-f), R9-Aβ42 (g-i), TR-Aβ42 (j-l) at 1-, 3- and 14 days post injection (dpi). small insets on the right of every panel are individual fluorescence channels and the composite from a close-up region. (Q) Coupling reaction for attaching fluorescein to peptides. (R) Fluorescein, TUNEL, S100β and PCNA, L-Plastin and HuC/D, Synptophysin immunostainings for PBSinjected, TR-Aβ38-injected and TR-Aβ42-scrambled peptide injected brains. (S) Quantification graphs for R. (T) Relative fold changes of inflammation-related genes. (U) Relative fold changes of synapse-related genes. Scale bars: 50 μm. Data are represented as mean ± SD. |