
|
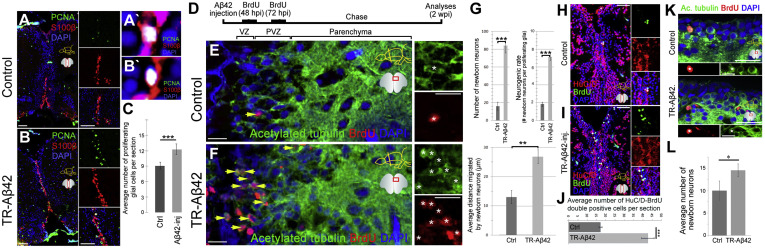
Fig. 2
Aβ42 Induces Stem Cell Proliferation and Neurogenesis in Adult Zebrafish Brain
(A) PCNA, S100β and DAPI in control brains. Insets: individual channels.
(A') High-magnification of a double-positive cell.
(B) PCNA, S100β, and DAPI in TR-Aβ42-injected brains.
(B') High-magnification of a double positive cell.
(C) Quantification for the average number of proliferating glial cells. Ctrl, control; inj, injected.
(D) Neurogenesis assay.
(E and F) Acetylated tubulin and BrdU in control (E) and TR-Aβ42-injected (F) brains. Insets: single channels.
(G) Number and migration distance of newborn neurons.
(H and I) HuC/D and BrdU in control (H) and TR-Aβ42-injected brains at 2 weeks post-injection (wpi).
(J) Quantification of HuC/D-BrdU double-positive cells.
(K) Acetylated tubulin and BrdU in control and TR-Aβ42-injected brains at 3 months after injection. Insets: examples of newborn neurons.
(L) Quantification of acetylated tubulin and BrdU double-positive cells per section.
Scale bars, 50 μm (A and B) and 20 μm (E, F, H, I, and K). Data are represented as mean ± SD; n = 3 fish. ∗p < 0.05; ∗∗p < 0.01; ∗∗∗p < 0.001. See also Figures S1 and S3 and Table S2.