
Fig. S7
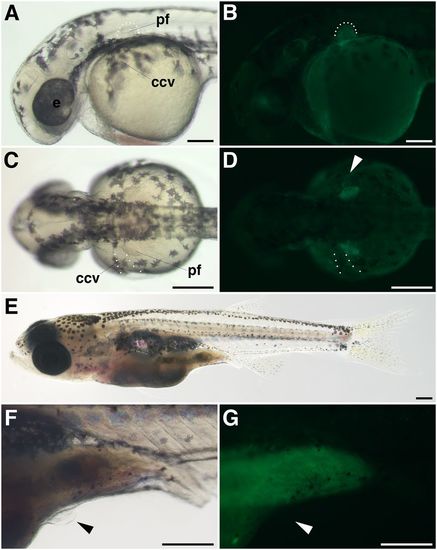
GFP expression pattern of gar CNS12 transgenic zebrafish. Brightfield (A, C, E, and F) and fluorescent (B, D, and G) images of gar CNS12 transgenic zebrafish. Lateral views in (A, B, and EG) and dorsal views in (C and D). (A and B) GFP expressions are found in the dorsal eye and pectoral fin bud at 36 hpf. Dotted lines outline the fin bud, in which GFP signals are detected in the mesenchyme. (C and D) GFP are expressed on the posterior edge of the ccv (dotted lines and arrowhead). (E) A 4-wk-old juvenile of the transgenic fish. (F) The juvenile has the pelvic fin bud (black arrowhead). (G) The fin bud does not show GFP signals (white arrowhead). A green emission is detected in the digestive tract. ccv, common cardinal vein; e, eye; pf, pectoral fin. (Scale bars: A-D, 200 µm; E-G, 500 µm.) |