
Fig. 1
- ID
- ZDB-FIG-160818-27
- Publication
- Muthu et al., 2016 - Rx3 and Shh direct anisotropic growth and specification in the zebrafish tuberal/anterior hypothalamus
- Other Figures
- All Figure Page
- Back to All Figure Page
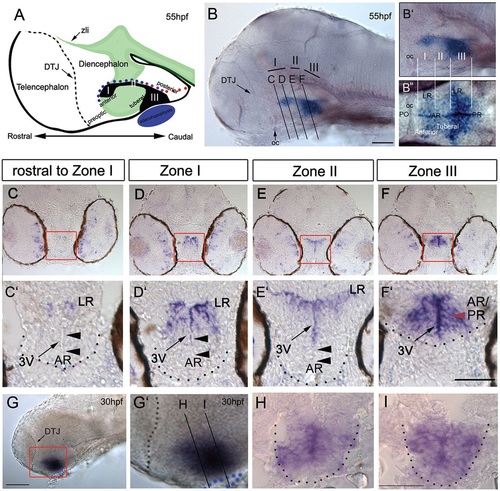
rx3 expression around the third ventricle. (A) Schematic of 55hpf forebrain indicating subdivisions of hypothalamus relative to the rostro-caudal axis and adenohypophysis (blue oval). Green and black show shh (Fig. 3) and rx3 expression. Dots depict rostro-caudal position of AR (blue) and PR (red) next to zone III (purple). (B-B′′) Whole-mount 55hpf embryo after rx3 in situ hybridization. In B, lines show planes of section shown in C-F. In B′,B′′ side and ventral views are aligned (white lines) and show position of rx3 relative to morphological landmarks (oc, optic commissure; PO, preoptic hypothalamus). (C-F′) Representative serial sections through a single embryo: bottom panels show high-power views of boxed regions. Red arrowheads point to zone III neuroepithelial-like cells; black arrowheads point to rx3- cells in AR tips. (G-I) Whole-mount side view of 30hpf embryo after rx3 in situ hybridization; lines in G′ show planes of sections shown in H,I. Dotted lines in C′-F′,H,I delineate outline of ventral hypothalamus, and in G,G′ delineate DTJ. zli, zona limitans intrathalamica. Scale bars: 50µm. |
| Gene: | |
|---|---|
| Fish: | |
| Anatomical Terms: | |
| Stage Range: | Prim-15 to Long-pec |