
Fig. 4
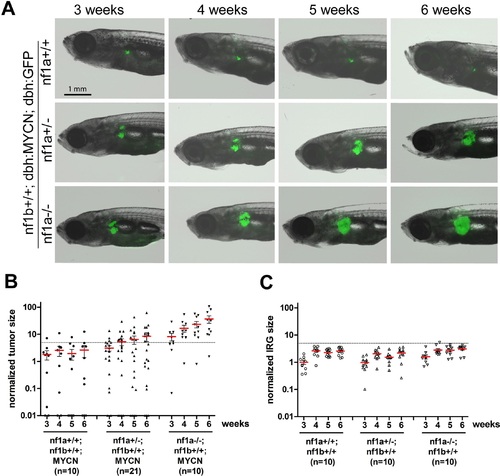
Loss of nf1 promotes neuroblastoma tumor progression in MYCN transgenic fish. (A) Neuroblastoma development in representative fish of the nf1a+/+;nf1b+/+;MYCN;GFP, nf1a+/-;nf1b+/+;MYCN;GFP and nf1a-/-;nf1b+/+;MYCN;GFP genotypes over 3 to 6 weeks of age.Each fish was imaged weekly for 3 continuous weeks from 3 weeks of age. (B) Quantification of GFP+ sympathoadrenal cells in the IRG of fish with nf1a+/+;nf1b+/+;MYCN;GFP (n = 10), nf1a+/-;nf1b+/+;MYCN;GFP (n = 21) and nf1a-/-;nf1b+/+;MYCN;GFP (n = 15) genotypes, demonstrating tumor progression over 3 weeks. Tumors were scored when the GFP+ signals in the IRG exceeded the threshold defined by the dotted line. (C) IRG development in nf1a mutant zebrafish lacking overexpression of MYCN. Quantification of GFP+ sympathoadrenal cells in the IRG of fish with nf1a+/+;nf1b+/+;GFP (n = 10), nf1a+/-;nf1b+/+;GFP (n = 10) and nf1a-/-;nf1b+/+;GFP (n = 10) genotypes. The same tumor threshold line shown in panel B is included for comparison. |
| Gene: | |
|---|---|
| Fish: | |
| Anatomical Term: | |
| Stage Range: | Days 21-29 to Days 30-44 |
| Fish: | |
|---|---|
| Observed In: | |
| Stage Range: | Days 21-29 to Days 30-44 |