
Fig. S1
- ID
- ZDB-FIG-160706-16
- Publication
- Raman et al., 2016 - aPKC regulates apical localization of Lgl to restrict elongation of microridges in developing zebrafish epidermis
- Other Figures
- All Figure Page
- Back to All Figure Page
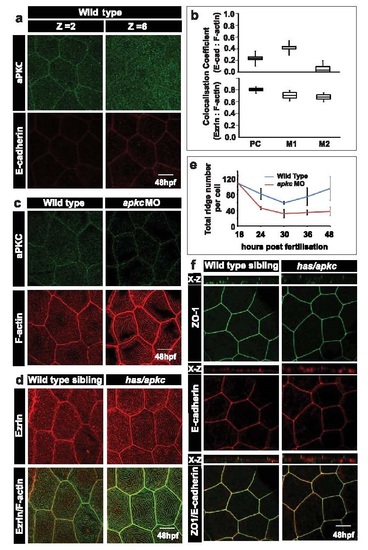
aPKC localises to the apical domain in peridermal cells but does not play a role in formation of cellular junctions. Immunostaining using anti-aPKC and E-cadherin antibodies (a) in wild-type embryos at 48hpf. Z=2 and Z=6 indicate the 2nd (apical) and the 6th (basolateral) confocal sections, respectively, from the apical side. Box-whisker plot for co-localisation coefficients (b; top) between E-cadherin and F-actin by Pearson’s method (PC) and Manders’ overlap of E-cadherin with F-actin (M1) and F-actin with E-cadherin (M2). Similar Pearson’s analysis (PC) between Ezrin and F-actin (b; bottom) and Manders’ overlap of Ezrin with F-actin (M1) and F-actin with Ezrin (M2) at 48hpf in wild-type embryos. Immuno-localisation using anti-aPKC antibody and phalloidin (c) in wild-type and apkc morphants at 48hpf. Immuno-localisation using anti-Ezrin antibody and phalloidin (d) in wild-type and has/apkc mutants at 48hpf. Quantification of total number of ridges (e) per peridermal cell during various developmental time points, based on phalloidin stainings performed in wild-type and apkc morphant embryos. Confocal images of stainings for ZO1 and E-cadherin in wild-type embryos and has/apkc mutants at 48hpf (f). X-Z are orthogonal sections. Basolateral marker E-cadherin does not localise to apical microridges (b) and serves as a negative control with Pearson coefficient=0.26+0.65. The E-cadherin antibody generates a few background speckles in the apical domain. Since some of these speckles fall on F-actin, it yields high Manders overlap coefficient of M1=0.413+0.14, which is misleading. However, F-actin shows very low overlap with E-cadherin background speckles yielding a very low Manders’ coefficient of M2=0.005+0.004. Ezrin serves as a positive control for correlation coefficient analysis. A major fraction of Ezrin localises with actin (b,d) giving rise to Pearson coefficient of 0.813+0.04. Similarly, Manders’ coefficients of Ezrin with F-actin (M1=0.73+0.09) and F-actin with Ezrin (M2=0.68+0.08) are high, reflecting significant overlap between Ezrin and F-actin (b,d). Scale bar = 10 µm. Abbreviations: PC- Pearson’s coefficient; M1 and M2- Manders overlap coefficients. |