
Fig. 5 S1
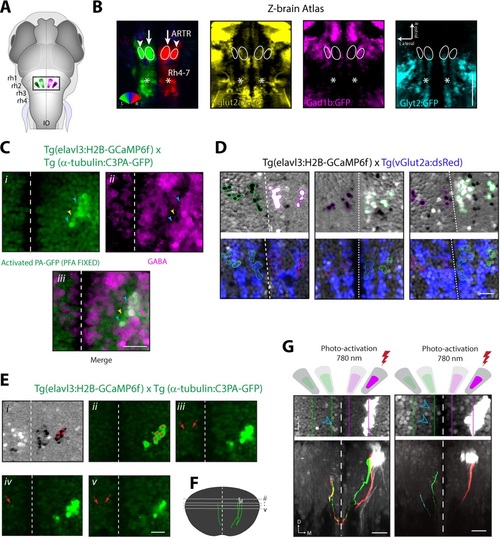
Cells of the lateral ARTR are inhibitory and project to the contralateral hindbrain. (A) Schematic of a 6 dpf zebrafish brain indicating the approximate location of the ARTR in the dorsal hindbrain. (B) Virtual colocalization comparing the location of the ARTR and caudal hindbrain signals relative to Z-Brain neurotransmitter labels. (C) Cells of the lateral ARTR are still marked with photoactivated PA-GFP after fixation in 4% PFA-PBS. N = 12 fish, one representative fish shown. (Ci-Ciii) A majority of the GFP-positive cells are reactive with GABA primary antibody (cyan arrows), with a minority of exceptions (yellow arrows). (D) Three additional example fish showing vGlut2a-expressing neurons enriched in the medial ARTR clusters. Top row, correlation maps of ARTR activity. Bottom row, vGlut2a expression. (Ei) Correlation map of ARTR activity. Cells of the right lateral cluster were identified (red asterisks) and photoactivated (red asterisks). (Eii-Ev) Four different slices (dorsal to ventral) showing the photoactivated cells (right of the midline) and PA-GFP-positive processes on the contralateral side (red arrows). N = 37, one fish shown. (F) Reconstruction of traced photoactivated neurites (not all neurites were traced). The approximate levels of the slices in Eii-Ev are indicated. The cells project dorso-ventrally and turn toward the midline, at which point they could not be followed anymore in this example. Processes reappear on the contralateral side. In this example, the traced neurite terminates in the vicinity of the contralateral medial ARTR cluster. The vertical dimension of the ARTR is 83 ± 8 µm (mean ± SD, 6 fish). (G) Two additional example fish showing projections from the lateral ARTR cluster to the contralateral ARTR cluster. Note that only a subset of ARTR neurons are activated and that the entire ARTR structure spans approximately 80 microns along the dorso-ventral axis. Out of 10 fish manually traced, all 10 had detectable projections from the lateral cluster to the medial cluster on the contralateral side, and 5 had detectable projections to the lateral cluster on the contralateral side. Scale bars: 20 µm. Dashed white lines, brain midline. |