
Fig. 5
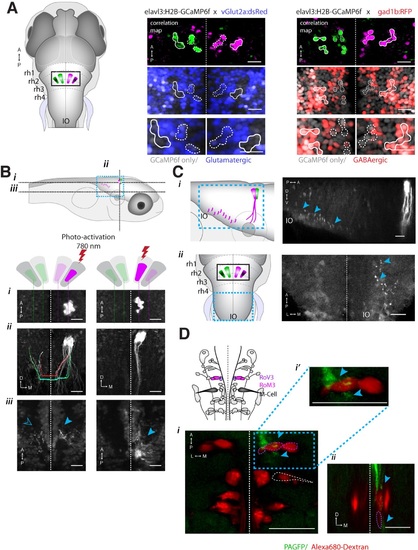
ARTR anatomy suggests mutual inhibition and connections to premotor neurons. (A) The medial ARTR is glutamatergic and the lateral ARTR is GABA-ergic. Left, Anatomical diagram showing the approximate location of the ARTR (black box) in rhombomeres 2–3. Green and magenta represent clusters influencing left and right turns, respectively. Right, The ARTR was functionally identified in two-photon imaging sessions (′Materials and methods′) in transgenic fish expressing H2B-GCaMP6f in most neurons and a red indicator either in the glutamatergic (left) or in the GABAergic (right) neurons. Overlaying the functional maps (top) in which the ARTR cells are identified by correlation reveals that the center clusters (dotted outlines) are glutamatergic and the lateral clusters (solid outlines) are GABAergic. For the vGlut experiments, N = 25 fish; GAD experiments, N = 11 fish; one representative fish shown for each. Scale bars, 20 µm. (IO) inferior olive; (rh1-4) rhombomeres 1-4. (B) The lateral ARTR projects contralaterally. Top, Anatomical diagram showing the approximate location of the planes shown below in (i), (ii), and (iii). The ARTR was identified as in (A) in Tg(H2B:GCaMP6f; α-tubulin-PAGFP) fish and PA-GFP was activated specifically in ARTR neurons of either the lateral cluster (left panels) or medial cluster (right panels). Projections were traced, revealing that the GABAergic cells of the lateral cluster cross the midline (dotted white line) toward the contralateral clusters (ii, left). The medial glutamatergic clusters project ventrally and ipsilaterally but were not found to cross the midline (ii and iii, right). Solid blue arrowheads, neurites in the hemisphere ipsilateral to the activated ARTR. Open blue arrowhead, neurites in the hemisphere contralateral to the activated ARTR. (C) Cells of the medial ARTR project to the ipsilateral IO. (i) The ARTR was functionally identified and photoactivated as in (B) in fish expressing PA-GFP and a red calcium indicator (Tg(elavl3:jRCaMP1a)). Left, schematic of the ARTR and PA-GFP-positive neurites projecting from the medial ARTR cluster and terminating in the IO (pink). Blue dashed rectangle represents the location of the region shown on the right. PA-GFP positive terminals are observed in the ipsilateral IO (blue arrowheads) (ii) Left, schematic showing the location (blue dashed rectangle) of (right) the top-down confocal image of the terminals shown in (i). (D) Cells of the medial ARTR send projections to a region nearby reticulospinal neurons. Top left, schematic of the reticulospinal system, adapted from Orger et al. (Orger et al., 2008), with RoV3, RoM3 and the Mauthner cell highlighted (Mauthner cell out of plane). (i) PA-GFP positive neurites (blue arrowheads) shown nearby RoV3 / RoM3 in fish where the reticulospinal neurons were retrogradely labeled with Alexa-680-dextran (red); panel (i′) shows a magnification of the boxed region. (ii) A coronal view of the two cells (RoV3/RoM3) shown in (i) and inset. Scale bars, 20 µm. A, anterior; P, posterior; L, lateral; M, medial; D, dorsal; V, ventral. |