
Fig. 3
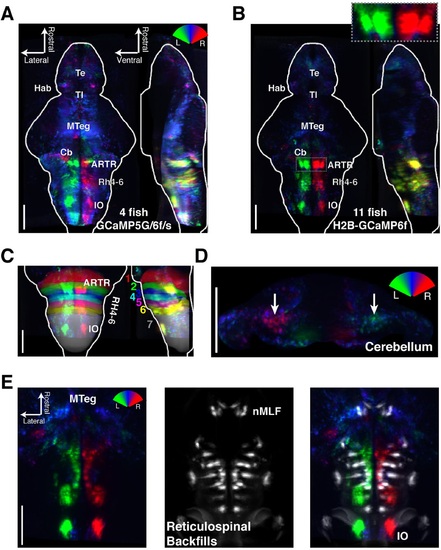
Functional anatomy of brain regions correlated with spontaneous behavior. Activity patterns consistently observed across fish highlighted by registering multiple fish to the Z-Brain atlas and averaging functional signals (see Supplementary methods). (A) Average functional stack resulting from Tg(elavl3:GCaMP6f) (N=2), Tg(elavl3:GCaMP5G) (N=1) and Tg(elavl3:GCaMP6s) larvae (N=1). Color represents tuning to fictive turning as in Figure 2. (B) Average functional stack resulting from Tg(elavl3:H2B-GCaMP6f) larvae (n=11). (C-E) Anatomical analyses of the average Tg(elavl3:H2B-GCaMP6f) maps in (B). (C) The positioning of hindbrain within the rhombomeres. (D) Untuned and some more weakly direction selective signals observed in the cerebellum. (E) Virtual colocalization comparing the position of ventral hindbrain and midbrain tegmentum (M-Teg) signals with the reticulospinal system. R2 = 0...0.12 (A-C), 0...0.06 (D-E). Scale bars, 100 &181;m. (Te) telencephalon; (Hab) habenula; (Tl) torus longitudinalis; (Cb) cerebellum; (ARTR) anterior rhombencephalic turning region; (Rh4-6) rhombomeres 4-6; (IO) inferior olive; (nMLF) nucleus of the medial longitudinal fasciculus. |