
FIGURE
Fig. 6
- ID
- ZDB-FIG-160331-3
- Publication
- Sridevi et al., 2014 - Optimization and validation of Mycobacterium marinum-induced adult zebrafish model for evaluation of oral anti-tuberculosis drugs
- Other Figures
- All Figure Page
- Back to All Figure Page
Fig. 6
|
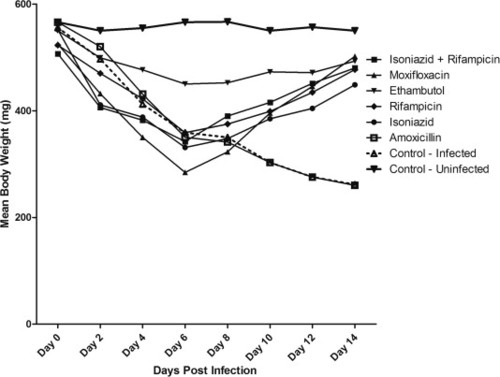
A. Mean body weight changes observed (Mean ± S.E.M., n = 10) with respective days post infection for all the groups during the study of M. marinum-induced adult zebrafish model. B. Percentage body weight reduction (Mean ± S.E.M., n = 10) over the study period for control and treated groups of M. marinum-induced adult zebrafish model. The statistical significance (∗p < 0.05, ∗∗p < 0.01 and ∗∗∗p < 0.001) with respect to un-infected control group has been analyzed by one-way ANOVA using GraphPad Prism Software. 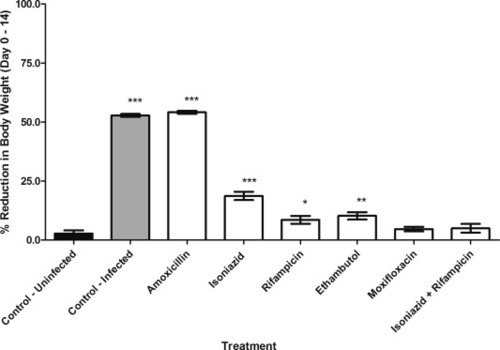
|
Expression Data
Expression Detail
Antibody Labeling
Phenotype Data
Phenotype Detail
Acknowledgments
This image is the copyrighted work of the attributed author or publisher, and
ZFIN has permission only to display this image to its users.
Additional permissions should be obtained from the applicable author or publisher of the image.
Full text @ Int J Mycobacteriol