
Fig. 2
- ID
- ZDB-FIG-160329-3
- Publication
- Bojarczuk et al., 2016 - Cryptococcus neoformans Intracellular Proliferation and Capsule Size Determines Early Macrophage Control of Infection
- Other Figures
- All Figure Page
- Back to All Figure Page
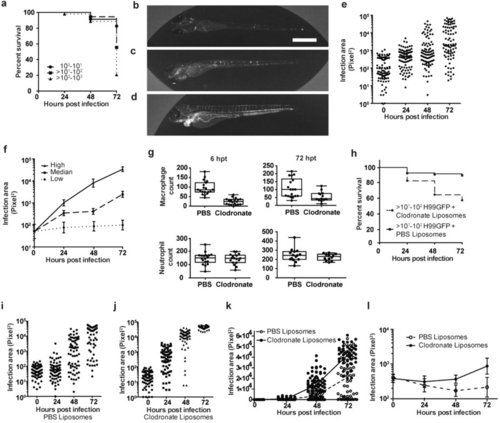
Macrophages are essential for control of cryptococcal fungemia.(a) Stratification of survival over 72 hpi from macrophage response data set. Survival is dependent on dose with a large change in survival between 101 and 103. 120 infections from n = 3 (each group contains: 100-101 = 23, >101-102 = 36, >102-103 = 53). (b-f) Representative images and quantitation of fungal burden from infections with inocula between >101-102 of Nacre-strain zebrafish (100 infections from n = 4). (b-d) Fluorescence images of low (b), median (c) and high (d). H99GFP infection of zebrafish at 72 hpi with inocula between >101-102. Scale bar is 500 µm. (e) Quantification of fungal burden using area of fluorescent pixels from C. neoformans strain H99GFP. Each point is a separate infection with inocula between >101-102, with the same 100 infections over 72 hours. (f) Stratification of (e) using 2log10 boundaries at 72 hpi. Geometric mean with 95% confidence intervals. (g) Zebrafish 24 hpf were injected with clodronate or PBS containing liposomes and the numbers of macrophages or neutrophils counted using Tg(mpeg1:mCherryCAAX)sh378 and Tg(mpx:GFP)i114 respectively at 6 and 72 hours post treatment. 15 treatments from n = 3. (h) Survival of Nacre-strain zebrafish infected with inocula between >101-102 of C. neoformans strain H99GFP at 48 hpf, following liposome treatment at 24 hpf. P < 0.0001, Log-rank (Mantel-Cox). hazard ratio = 4.5 (logrank; 95% confidence interval 3.2,7.7). 140 and 178 infections from clodronate and PBS groups respectively from n = 3. (i-k) Quantification of fungal burden using area of fluorescent pixels from Nacre-strain zebrafish infected with inocula between >101-102 of C. neoformans strain H99GFP at 48 hpf following treatment with liposomes at 24 hpf. Each point the same 75 infections over 72 hours from n = 3. (i) PBS (j) Clodronate (k) Linear comparison of individual infection and mean fungal burden values with PBS (open circles and dotted line respectively) or clodronate (filled circles and solid line respectively) treatment. Values are the same as presented (i) and (j). (l) Quantification of fungal burden using area of fluorescent pixels from Tg(mpeg1:mCherryCAAX)sh378 strain zebrafish infected with <5 × 101 of C. neoformans strain H99GFP at 48 hpf followed by injection with liposomes at 24 hpi (72 hpf). Points are geometric mean with 95% confidence intervals. The same 25 infections over 72 hours. |