
Fig. 1
- ID
- ZDB-FIG-160329-2
- Publication
- Bojarczuk et al., 2016 - Cryptococcus neoformans Intracellular Proliferation and Capsule Size Determines Early Macrophage Control of Infection
- Other Figures
- All Figure Page
- Back to All Figure Page
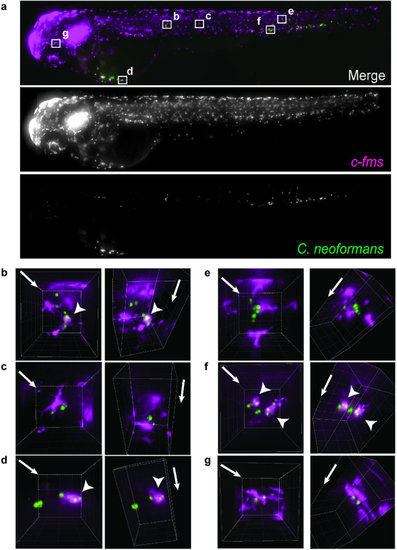
Quantification of macrophage behavior in response to Cryptococcus during infection.(a) Maximum intensity z-projection of example image data from high content imaging (see Supplementary Fig. S1) of Tg(fms:Gal4.VP16)i186 ; Tg(UAS:nfsB.mCherry)i149 zebrafish, with mCherry labeled macrophages (magenta), infected with 148 cells of C. neoformans strain H99GFP (green), at 2 hours post infection. (b-d) Areas boxed in (a) enlarged and reconstructed in three-dimensions. Arrowheads indicate intracellular cryptococci. Image pairs represent different views of same volume with arrows indicating z-axis direction. Image grid is 20 µm. Images are representative of a total of 120 infections from n = 3 repeats (40 infections per independent repeat group). |