
Fig. S3
- ID
- ZDB-FIG-160309-18
- Publication
- Tang et al., 2016 - Imaging tumour cell heterogeneity following cell transplantation into optically clear immune-deficient zebrafish
- Other Figures
- All Figure Page
- Back to All Figure Page
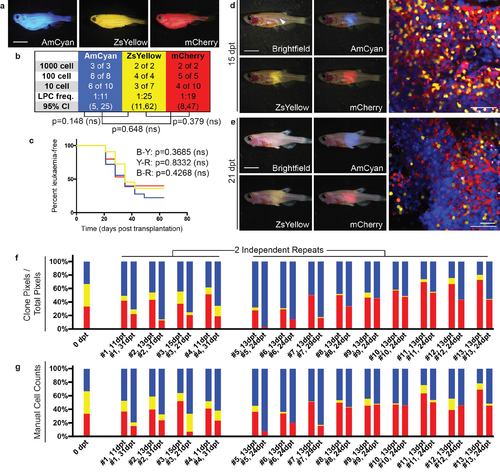
Emergence of clonal dominance among three similar TALL clones. (a) Donor animals engrafted with monoclonal T-ALL arising in the CG1 background. (b-c) Monoclonal T-ALLs were implanted into syngeneic CG1 strain fish and assessed for LPC frequency by limiting dilution cell transplantation (b) or latency of regrowth (c). T-ALLs have similar LPC frequency and latency, with p-values noted on each panel. (d-e) Confocal imaging of engrafted rag2E450fs (casper) fish at 15 dpt (d) and 21 dpt (e). White arrow denotes site of injection and imaging. (f-g) Relative proportions of each fluorescent clone contained within individual engrafted animals quantified by fluorescence area within confocal images (f) and manual cell counts (g). Scale bars equal 5 mm in whole animal images and 50 µm in confocal images. |