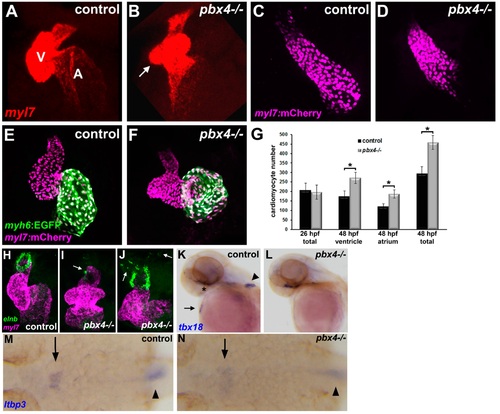
Cardiac chamber, outflow tract, and proepicardial development defects in pbx4 mutant embryos. (A,B) RNA in situ expression of cardiomyocyte differentiation gene myl7 (red) at 48 hpf in (A) control (n = 16) and (B) pbx4b557-/- (n = 4) embryos. V, ventricle. A, atrium. Arrow in (B) points to abnormal bulge in pbx4b557-/- ventricle. (C,D) Cardiomyocyte nuclei (magenta) in 26 hpf Tg(myl7:h2afva-mCherry)sd12 (C) control (n = 13) and (D) pbx4b557-/- (n = 9) embryos. (E,F) Cardiomyocyte nuclei (magenta) in 48 hpf Tg(myl7:h2afva-mCherry)sd12 (E) control (n = 9) and (F) pbx4b557-/- (n = 7) embryos. Tg(myh6:EGFP)s958 (green) is used to identify atrial cells. (G) Graph displaying cardiomyocyte nuclei count data at 26 hpf and 48 hpf. Error bars represent standard deviation. * P < 0.00003. (H,J) RNA in situ expression of outflow tract smooth muscle marker elnb (green) and myl7 (magenta) at 72 hpf in (H) control and (I,J) pbx4b557-/- embryos. In control embryos (n = 15), elnb expression appears as a ring (H). In pbx4b557-/- embryos, elnb expression can appear reduced (arrow in I; 5/9 embryos) or expanded and bifurcated (arrows in J; 4/9 embryos). (K,L) RNA in situ expression of tbx18 at 48 hpf in (K) control and (L) pbx4b557-/- embryos. tbx18 expression in pectoral fin (arrowhead) and proepicardial cells (arrow) is lost in pbx4b557-/- embryos (n = 9) compared to controls (n = 11), while facial expression (asterisk) is maintained. Hearts and embryos are shown in ventral view, anterior toward the top. (M,N) RNA in situ expression of ltbp3 at 24 hpf in (M) control and (N) pbx4b557-/- embryos. ltbp3 expression in second heart field domain (arrows) appears broader yet weaker in pbx4b557-/- embryos (n = 10, all weaker expression) compared to controls (n = 45, all similar), while notochord expression (arrowheads) is maintained. Embryos are shown in dorsal view, anterior towards the left.
|
