
FIGURE
Fig. 2
Fig. 2
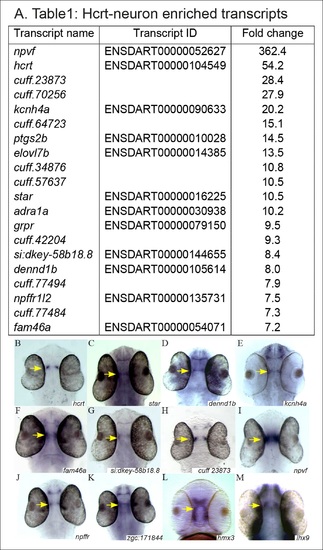
The expression pattern of selected candidate Hcrt-neuron–specific genes. (A) Table presenting the top 20 Hcrt-enriched transcripts. (B–M) Dorsal view of whole-mount ISH-stained 2 dpf WT larvae. Based on the RNA-seq and the bioinformatic analysis, the expression pattern of selected candidate Hcrt-neuron–specific genes was determined. The expression pattern of hcrt (B) was used for comparison. |
Expression Data
| Genes: | |
|---|---|
| Fish: | |
| Anatomical Terms: | |
| Stage: | Long-pec |
Expression Detail
Antibody Labeling
Phenotype Data
Phenotype Detail
Acknowledgments
This image is the copyrighted work of the attributed author or publisher, and
ZFIN has permission only to display this image to its users.
Additional permissions should be obtained from the applicable author or publisher of the image.
Full text @ Elife