
Fig. S2
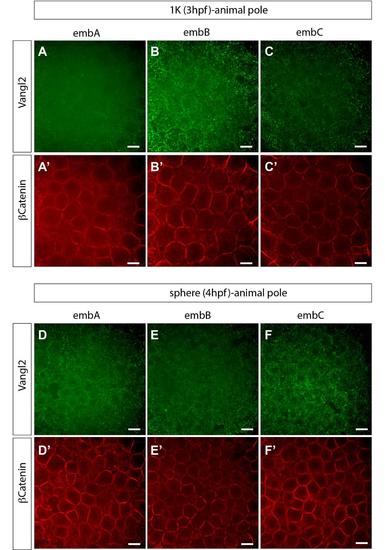
Vangl2 protein expression at blastula stages. Confocal images of embryos after immunostaining using the anti-C-terminal Vangl2 antibody (green) and anti-β-catenin (red). β-catenin staining was used as control in order to visualize the cell membranes. Several embryos are shown in order to represent the variability of the anti-Vangl2 staining at the membrane versus cytoplasm between embryos at the same developmental stage. All images were acquired at the animal pole location. (A-C′) 3 different embryos at sphere stage (4hpf). (D-F′) 3 different embryos at 1K stage (3hpf). Note the weak Vangl2 staining (green) at the membrane and the abundant puncta in the cytoplasm. Scale bars, 20 µm. |