
Fig. 6
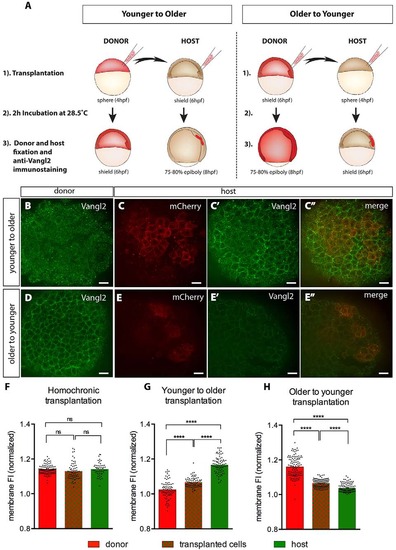
Heterochronic cell transplantations. (A) The experimental scheme. (B-E′′) Confocal images of donor and host embryos after immunostaining for Vangl2 and mCherry. (B-C′′) Results of transplantation from younger donor embryos into older hosts. (B) Donor embryo 2h post transplantation, 6hpf. (C-C′′) Host embryo 2h post transplantation, 8hpf. (D-E′′) Results of transplantation from older donor embryos into younger hosts. (D) Donor embryo 2h post transplantation, 8hpf. (E-E′′) Host embryo 2h post transplantation, 6hpf. (C,E) mCherry staining shows the transplanted cells. (F-H) Quantitative data showing the membrane fluorescence intensity (FI) in transplanted cells, and endogenous cells in host and donor embryos. Quantitative data are from homochronic (control) and heterochronic cell transplantations. Bars represent the mean FI. ****P<0.0001; ns, not significant; unpaired t-test with Welch′s correction. Scale bars: 20µm. |