
Fig. 5
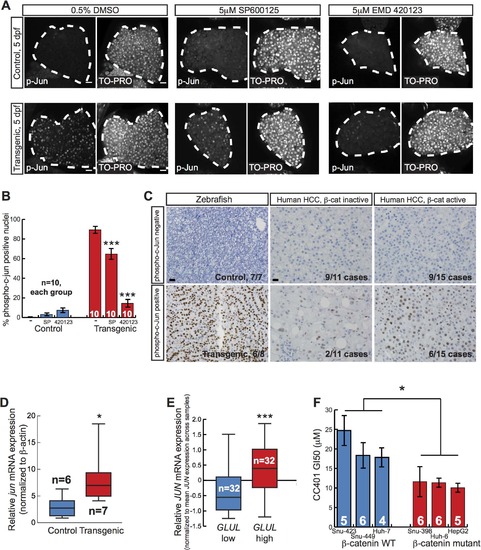
Activated β-catenin is associated with JNK pathway activation. (A) Representative whole-mount immunofluorescence images and (B) quantification of 5-day-old control sibling and transgenic larvae treated for 2 days with 0.5% DMSO alone, 5 µM SP600125, or 5 µM EMD 420123 and stained with antibodies against phospho-c-Jun (left panels) and TO-PRO nuclear stain (right panels). Livers are outlined in white. Scale bar, 20 µm. N values are shown above the x-axis. Drug-treated zebrafish were compared to DMSO-treated siblings with the same genotype using 2-way ANOVA. ***, p<0.001. (C) Representative photographs of zebrafish control and Tg(fabp10a:pt-β-cat) livers (left) and human HCC without (middle) and with (right) activated β-catenin, stained with anti-phospho-c-Jun antibodies. For zebrafish, 6 out of 8 (75%) Tg(fabp10a:pt-β-cat) livers with HCC contained one or more foci with moderate or high nuclear phospho-c-Jun staining (phospho-c-Jun positive), while all non-transgenic control livers (N = 7) without activated β-catenin showed absent or low staining (phospho-c-Jun negative). For human HCC, the number of cases exhibiting each staining pattern and the total number of cases with a given β-catenin activation status are shown at the bottom right of each picture. Images counterstained with hematoxylin. Scale bars, 20 µm. (D) Normalized jun mRNA expression in control sibling and transgenic adult zebrafish livers. Three technical replicates were performed for each sample. *, p<0.05, Mann-Whitney test. N values are shown above the x-axis. (E) Normalized JUN mRNA expression for human HCC with low GLUL and high GLUL expression. ***, p<0.001, Mann-Whitney test. (F) Graph showing dose of JNK inhibitor CC401 at which cell viability of human cancer cell lines was decreased by 50% (GI50), ± SEM. Number of replicates for each cell line is shown above the x-axis. *, p<0.05, unpaired t-test. |
| Antibody: | |
|---|---|
| Fish: | |
| Condition: | |
| Anatomical Terms: | |
| Stage Range: | Day 5 to Adult |