
Fig. S2
- ID
- ZDB-FIG-150715-5
- Publication
- Xiong et al., 2015 - Multibow: Digital Spectral Barcodes for Cell Tracing
- Other Figures
- All Figure Page
- Back to All Figure Page
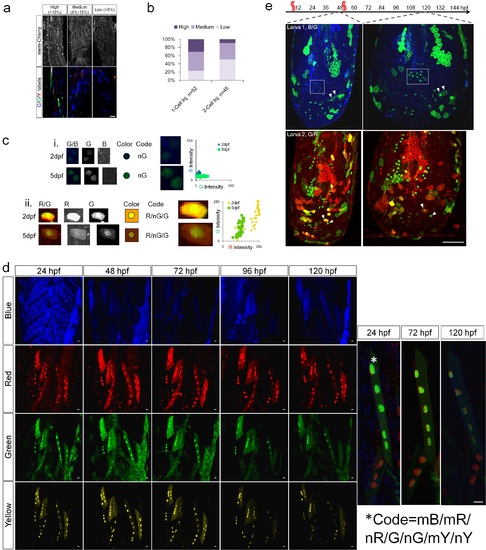
Coverage and Stability of Color Codes. a. Cell fraction coverage of Multibow analyzed by co-injecting the complete Multibow cocktail with mem-cherry mRNA. The presence of a strong Red ubiquitous marker (mem-cherry) excludes labeled cells by mR/R to be identified. The actual fraction using all Multibow channels may be higher. The coverage is categorized as "high", "medium" and "low" depending on the fraction of cells labeled. Scale Bar: 10µm. b. Summary of injected embryos by fraction of Multibow labeled cells as categorized in panel a. 1-Cell stage injection is critical for higher fraction of labeled cells. c. (i) Example cells in which background intensity in Blue channel has dropped while nG intensity increased. (ii) Example cell in which both total and relative intensity of FPs have changed. These cells appear to have changed “color” but can be identified based on the unchanged ON/OFF status of individual tagged FPs. Pixel channel intensity distribution of cells were further analyzed in down-sampled images of 1/8 original pixel number (down-sampling was used to reduce the number of pixels to analyze). The RGB intensity values of pixels belonging to the cells were plotted for both time points. The colors of the same cell(s) may change as a result of signal changes between different acquisition times, as reflected by a shift of pixel distribution in the RGB color space. The cells were from experiments in panel e. d. Label stability of color codes to intensity changes. A lateral region of a group of labeled muscle cells were followed for 5 days after injection of 12 Multibow constructs (R/G/Y/B) and heat-shock for 1 hour at 22hpf. The expression profiles of the same cells are invariant during this time despite intensity fluctuations. Four channels were used. Note the 24hpf blue image shows ubiquitous labeling of nuclei by the heat-shock induced Cre-Cerulean expression in this tg(hsp70:cerulean-cre) individual, which fades away afterwards (See also Fig c in S1 Fig). The enlarged merged views show an example cell that apparently changed color due to intensity fluctuations but kept the same Multibow barcode. Scale bars: 10µm. e. Intensity fluctuation tests. The embryos were injected with 6 constructs (B/G for the upper panel and G/R for the lower panel, respectively). Heat-shock labeling and imaging were performed as labeled in the timeline. The tissue undergoes growth, and clonal expansion of labeled cells is evident (boxes in the upper panel). The color codes remain unchanged (e.g. arrowheads in the lower panel) even though the intensities of expression may change (boxes in the upper panel). No new color codes appear after the second heat-shock, indicating completion of recombination by the first heat-shock. Scale Bar: 100µm. |