
Fig. S1
- ID
- ZDB-FIG-150715-4
- Publication
- Xiong et al., 2015 - Multibow: Digital Spectral Barcodes for Cell Tracing
- Other Figures
- All Figure Page
- Back to All Figure Page
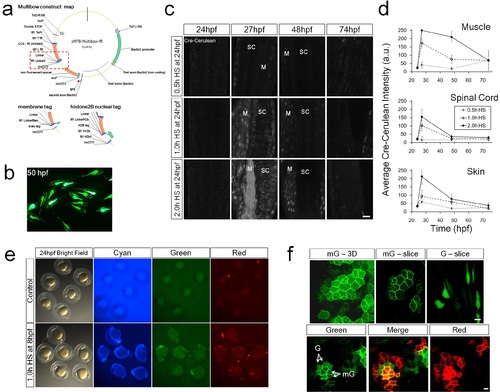
Design and Validation of Multibow. a. Multibow construct map for use in the Zebrafish system. Example construct is pMTB-Multibow-fR(mKate2). Red box: variable region where membrane and nuclear tagged versions are different from the map. See sequence files for details. See also S1 Table. b. Mosaic and uneven distribution of injected DNA. Embryos were injected at 1-cell stage with 20ng/µl pMTB-citrine DNA construct. Yolk is bright with autofluorescence. c. Analysis of Cre level dynamics in tg(hsp70:cerulean-cre). SC, spinal cord. M, muscle. 0.5h heat-shock does not induce significant Cerulean-Cre expression. Muscle cell expression is more sensitive to heat-shock. Low level expression is also present in some muscle cells without heat-shock. 1.0h heat-shock provides an optimal pulse. Scale Bar: 10µm. d. Average fluorescent intensities (+/- s.d.) measured in 10 nuclei from the images in c. e. Onset of Multibow after heat-shock induced Cre expression. The whole pool of 21 constructs were injected. The time required for Multibow to become detectable after Cre induction limits its application for lineage tracing in early stage zebrafish embryos before 20 hours post fertilization (hpf). However, the early stages are often more feasible for direct live imaging based lineage analysis [12,13,31]. f. Distinction of membrane and cytoplasmic signals. In 3D projection images (most of the figures) it may be difficult to distinguish signals of membrane and cytoplasmic origin, as bright membrane signal is often detectable in cytoplasm and in 3D overlay the signals overlap. Looking through original confocal slices removes most of the difficulties. The top images show a comparison of membrane signal in 3D rendering and slice view, and a slice view of a cytoplasmic signal. The main distinction is a bright edge and fuzzy cytoplasmic signal for membrane FPs and a homogenous signal throughout for untagged FPs. Bottom images show the contrast of neighboring cells with membrane labeled vs. untagged FPs of the same color. Difficulties may rise when trying to distinguish the presence of both membrane and cytoplasmic signals of the same FP when the membrane signal is much brighter (See Discussion). |