
Fig. 3
- ID
- ZDB-FIG-150710-4
- Publication
- Otsuna et al., 2015 - High-resolution analysis of CNS expression patterns in zebrafish Gal4 enhancer-trap lines
- Other Figures
- All Figure Page
- Back to All Figure Page
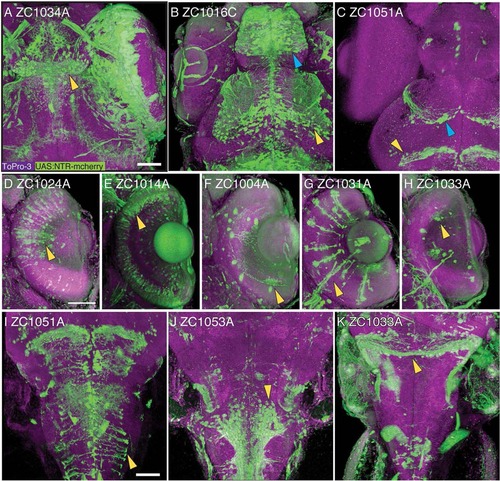
Confocal 3-D reconstruction images of 5 dpf embryos. Rostral CNS expression patterns are visible in the habenula (A, arrowhead), the telencephalon (B, blue arrowhead) and ventral tectum (B, yellow arrowhead), glial cells in the tectum (C, blue arrowhead) and midbrain–hindbrain boundary (C, yellow arrowhead). Expression is visible in major classes of retinal neurons including bipolar cells (D), photoreceptors (E), amacrine cells (F), Mueller glia (G), and ganglion cells (H). In the brainstem, expression is visible in radial glia (I), ventral neurons (J), and the rostral cerebellum (K). All images show UAS reporter (green), ToPro3 nuclear stain (magenta), and show dorsal view, with D–H showing a section through the retina. Scale bar = 50 µm. |
| Gene: | |
|---|---|
| Fish: | |
| Anatomical Terms: | |
| Stage: | Day 5 |