
FIGURE
Fig. 4
- ID
- ZDB-FIG-150710-5
- Publication
- Otsuna et al., 2015 - High-resolution analysis of CNS expression patterns in zebrafish Gal4 enhancer-trap lines
- Other Figures
- All Figure Page
- Back to All Figure Page
Fig. 4
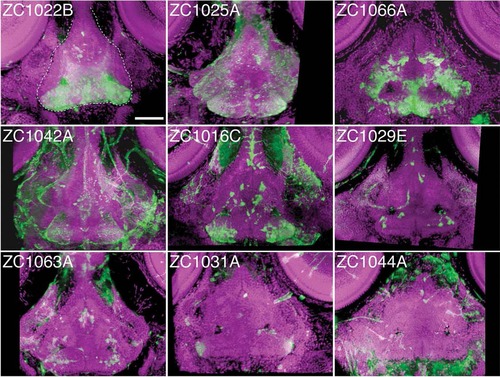
Individual enhancer traps drive various hypothalamic expression patterns. The 3D reconstructed confocal images, dorsal view, of 5 dpf whole-mount embryos stained for UAS reporter (green) and counterstained with ToPro-3 for nuclei (magenta). Partial 3D reconstruction of these images has been limited to ventral confocal planes to highlight hypothalamic expression while removing more dorsal expressing cells. Dashed white line in panel zc1022B outlines the hypothalamus. Scale bar = 50 µm. |
Expression Data
| Gene: | |
|---|---|
| Fish: | |
| Anatomical Term: | |
| Stage: | Day 5 |
Expression Detail
Antibody Labeling
Phenotype Data
Phenotype Detail
Acknowledgments
This image is the copyrighted work of the attributed author or publisher, and
ZFIN has permission only to display this image to its users.
Additional permissions should be obtained from the applicable author or publisher of the image.
Full text @ Dev. Dyn.