
Fig. 2
- ID
- ZDB-FIG-150629-7
- Publication
- Rossi et al., 2015 - The SLC7A7 Transporter Identifies Microglial Precursors prior to Entry into the Brain
- Other Figures
- All Figure Page
- Back to All Figure Page
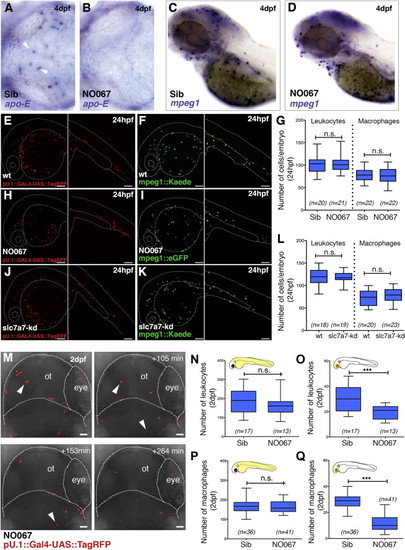
Characterization of the NO067 Zebrafish Mutant (A and B) WISH for apo-E in a sibling (A) and NO067 mutant (B) brain at 4 days post fertilization is shown. White arrows indicate apo-E+ microglia. (C and D) WISH for mpeg1 in a sibling (C) and NO067 mutant (D) embryo at 4 days post fertilization is shown. (E, H, and J) Lateral view shows a representative pU1::TagRFP wild-type (E), mutant (H), and slc7a7 morphant (J) at 24 hpf. (F, I, and K) Lateral view shows a representative mpeg1::Kaede wild-type (F), mpeg1::Kaede morphant (K), and mpeg1::eGFP mutant (I) at 24 hpf. (G and L) Numbers of leukocytes and macrophages in siblings and mutants (G) and wild-type and slc7a7 morphants (L) at 24 hpf are shown. (M) Representative time-lapse images show two leukocytes undergoing apoptosis within the head region of a NO067;pU.1::TagRFP embryo (white arrowheads). Dotted line indicates the shape of the head and the eye. (N–Q) Numbers of leukocytes (N and O) and macrophages (P and Q) in siblings and mutants in the head (N and P) and rest of the body (O and Q) at 2 days post fertilization are shown, as indicated in yellow in the schematics. p < 0.0005, Mann-Whitney test. Scale bars for all images, 25 µm. Sib, sibling; n, number of embryos. See also Figures S2 and S3 and Movie S1. |
| Genes: | |
|---|---|
| Fish: | |
| Knockdown Reagent: | |
| Anatomical Terms: | |
| Stage Range: | Prim-5 to Day 4 |
| Fish: | |
|---|---|
| Knockdown Reagent: | |
| Observed In: | |
| Stage Range: | Prim-5 to Day 4 |