
Fig. 1
- ID
- ZDB-FIG-150629-6
- Publication
- Rossi et al., 2015 - The SLC7A7 Transporter Identifies Microglial Precursors prior to Entry into the Brain
- Other Figures
- All Figure Page
- Back to All Figure Page
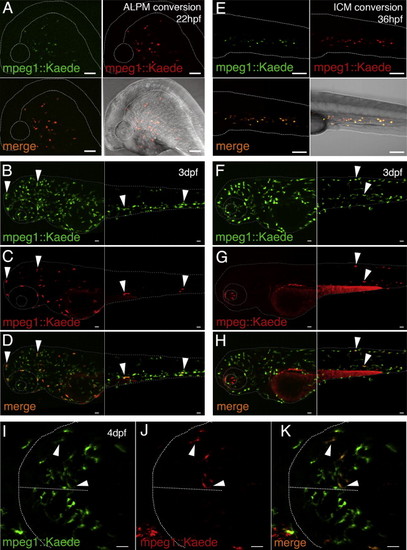
Microglia Derive from ALPM Yolk-Sac Macrophages with No Contribution from the ICM (A) Photoconversion of ALPM macrophages. Side views of a 22-hpf photoconverted embryo (mpeg1::Kaede) are shown (top left, Kaede green; top right, Kaede red; bottom left, overlay of green and red; bottom right, overlay with bright field). (B–D) Side view shows a 3-day-post-fertilization embryo previously photoconverted at 22 hpf (B, Kaede green; C, Kaede red; D, overlay). (E) Photoconversion of ICM macrophages. Side views of a 36-hpf photoconverted embryo (mpeg1::Kaede) are shown (arranged as in A). (F–H) Side view shows a 3-day post-fertilization embryo previously photoconverted at 36 hpf (F, Kaede green; G, Kaede red; H, overlay). Red labeling in the eye is due to autofluorescence of the sample. (I–K) Dorsal view shows a 4-day-post-fertilization embryonic brain previously photoconverted at 22 hpf in the ALPM region (I, Kaede green; J, Kaede red; K, overlay). Dotted line indicates the shape of the brain and the two hemispheres. White arrowheads indicate Kaede+ cells showing both green and red emission. Scale bars for all images, 50 µm. See also Figure S1. |
| Gene: | |
|---|---|
| Fish: | |
| Anatomical Terms: | |
| Stage Range: | 26+ somites to Day 4 |