
Fig. 2
- ID
- ZDB-FIG-150617-2
- Publication
- Wu et al., 2015 - Hypoxia-Induced Retinal Neovascularization in Zebrafish Embryos: A Potential Model of Retinopathy of Prematurity
- Other Figures
- All Figure Page
- Back to All Figure Page
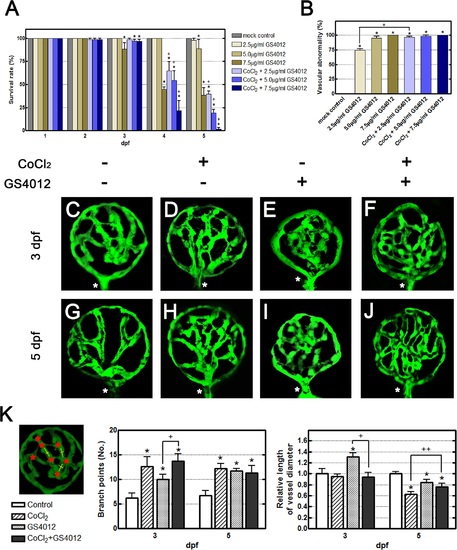
Effects of CoCl2 and the VEGF inducer GS4012 on retinal neovascularization. (A, B) Time-course and dose-dependent effects of GS4012 on the survival rate and the vascular defect-occurrence rates of Tg(fli1a:EGFP) embryos are shown. Embryos were treated with 2.5, 5, or 7.5 µg/mL of GS4012 and 5 mM CoCl2 for 1, 2, 3, 4, and 5 dpf. Each bar of the survival rate and the vascular defect-occurrence rates represents the mean ± SEM (n = 50 in each group). * p < 0.01 and + p < 0.001, as compared with the control group and the equivalent concentration of GS4012 group, respectively. (C–J) Fluorescence microscope observations of the retinal vessels of treated Tg(fli1a:EGFP) embryos are shown. At 3 dpf, compared with the untreated control (C), both CoCl2 and GS4012 induced vessel branching in the retina (D, E). Zebrafish embryos cotreated with CoCl2 and GS4012 showed severe branching and disorganization in the retinal vasculature (F). At 5 dpf, compared with the untreated control (G), CoCl2-treated retinal vessels were narrow, indicating vasoconstriction (H), and GS4012-treated vessels appeared tortuous and twisted (I). Furthermore, cotreatment with CoCl2 and GS4012 induced a complex, highly disorganized, and tortuous vasculature (J). (K) The left panel shows the method for counting and measuring branch points (red asterisks) and vessel diameters (yellow line). The vessel diameters were measured using Image J (three randomly chosen positions). These data consist of observed characteristics. Each bar of the branch points and vessel diameter chart represents the mean ± S.D. (n = 5 in each group). * p < 0.01, as compared with the control group. + p < 0.01 and ++ p < 0.001, as cotreatment groups compared with the equivalent concentration of GS4012 and CoCl2 group, respectively. |
| Gene: | |
|---|---|
| Fish: | |
| Conditions: | |
| Anatomical Term: | |
| Stage Range: | Protruding-mouth to Day 5 |
| Fish: | |
|---|---|
| Conditions: | |
| Observed In: | |
| Stage Range: | Protruding-mouth to Day 5 |