
Fig. 5
- ID
- ZDB-FIG-150526-11
- Publication
- Petersen et al., 2015 - The adhesion GPCR GPR126 has distinct, domain-dependent functions in Schwann cell development mediated by interaction with laminin-211
- Other Figures
- All Figure Page
- Back to All Figure Page
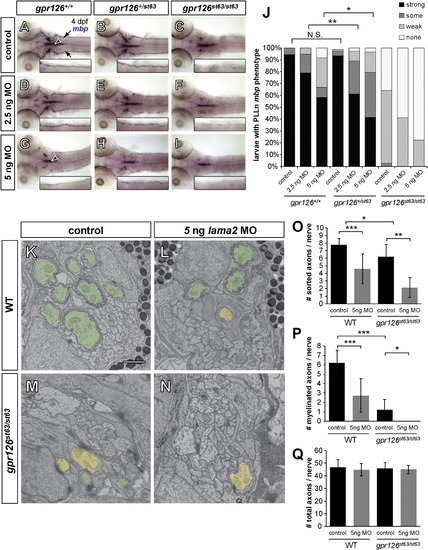
lama2 Knockdown Enhances gpr126 Hypomorphic Phenotype (A–I) Dorsal views of mbp expression by WISH in 4 dpf larvae. Insets: magnification of the right PLLn. Control, injected with phenol red dye only; MO, lama2 morpholino-injected. (A–C) Control-injected larvae. (A) mbp expression is strong in the PLLn of a WT (gpr126+/+) larva. Arrows indicate the PLLn, and the arrowhead indicates the CNS. (B) mbp in a heterozygous (gpr126+/st63) larva is indistinguishable from WT. (C) mbp is reduced, but not absent, in the PLLn of a homozygous gpr126st63/st63 hypomorph. (D–F) Larvae injected with low-dose (2.5 ng) lama2 MO. (D) mbp is not disrupted in a gpr126+/+ larva. (E) mbp is reduced in the PLLn of a heterozygous gpr126+/st63 larva relative to control-injected. (F) mbp is further reduced in a gpr126st63/st63 larva. (G–I) Larvae injected with high-dose (5 ng) lama2 MO. (G) mbp is disrupted in both the CNS (arrowhead) and PLLn in a gpr126+/+ larva. (H) mbp is further reduced in a heterozygous gpr126+/st63 larva. (I) mbp is nearly absent in the PLLn of a gpr126st63/st63 larva. (J) Quantification of WISH expressed as a percentage of larvae with each mbp PLLn phenotype at 4 dpf. Asterisks indicate a significant decrease of “strong” expression. p < 0.05, p < 0.01, Fisher’s exact test. Control, pooled uninjected and phenol red-injected. (K–N) TEM of 3 dpf zebrafish PLLn. Sorted and myelinated axons are defined and pseudocolored as in Figure 1. The scale bar represents 1 µm. (K and L) Myelination proceeds normally in a control-injected gpr126+/+ sibling (K), but radial sorting and myelination are reduced with 5 ng MO in gpr126+/st63 (L). (M and N) Myelination is reduced in a gpr126st63/st63 hypomorph (M), and is further reduced in a gpr126st63/st63 sibling injected with 5 ng MO (N). (O–Q) Quantification of TEM images. Bars represent means ± SD. p < 0.05, p < 0.01, p < 0.001, one-way ANOVA with Bonferroni’s multiple comparisons test. (O) Number of sorted axons per PLLn. (P) Number of myelinated axons per PLLn. (Q) Number of total axons per PLLn. |
| Gene: | |
|---|---|
| Fish: | |
| Knockdown Reagent: | |
| Anatomical Term: | |
| Stage: | Day 4 |
| Fish: | |
|---|---|
| Knockdown Reagent: | |
| Observed In: | |
| Stage Range: | Protruding-mouth to Day 4 |