
Fig. 4
- ID
- ZDB-FIG-150511-11
- Publication
- Otis et al., 2015 - Zebrafish as a model for apolipoprotein biology: Comprehensive expression analysis and a role for ApoA-IV in regulating food intake
- Other Figures
- All Figure Page
- Back to All Figure Page
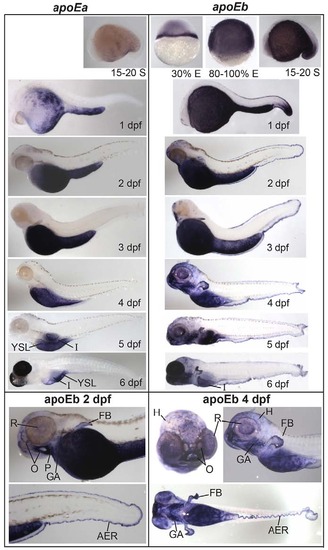
apoEa localization to the YSL and intestine contrasts with widespread expression of apoEb. apoEa and apoEb mRNA expression observed by ISH during blastulation [30% epiboly (E)], gastrulation (80% E), somitogenesis [15-20 somite (S)] and 1-6 dpf. apoEa mRNA is expressed in distinct subregions of the YSL at somitogenesis and 1 dpf, and ubiquitously throughout the YSL from 2-5 dpf. At 6 dpf (but not 5 dpf), apoEa is observed in the intestine (I). apoEb is expressed not only throughout the YSL (30% E to 5 dpf), but also in the tail bud (15-20 S and 1 dpf), the apical ectodermal ridge (AER) (1-6 dpf), the head (H) (1-6 dpf), mouth and nose orifices (O) (2-6 dpf), the find buds (FB) (2-6 dpf), pharynx (P) (2-6 dpf), gill arches (GA) (3-6 dpf), periderm (4-6 dpf), retina (R) (4-6 dpf), intestine (6 dpf) and swim bladder (6 dpf). No expression of apoEa was observed during blastulation or gastrulation, or for either gene at the eight-cell stage (supplementary material Fig. S3). Zebrafish are wild type, except for 6-dpf larvae which are nacre-/-; 1-6 dpf larvae were treated with hydrogen peroxide to remove pigmentation. ISH was performed in triplicate with ne5 embryos or larvae per probe per experiment. |
| Genes: | |
|---|---|
| Fish: | |
| Anatomical Terms: | |
| Stage Range: | 30%-epiboly to Day 6 |