|
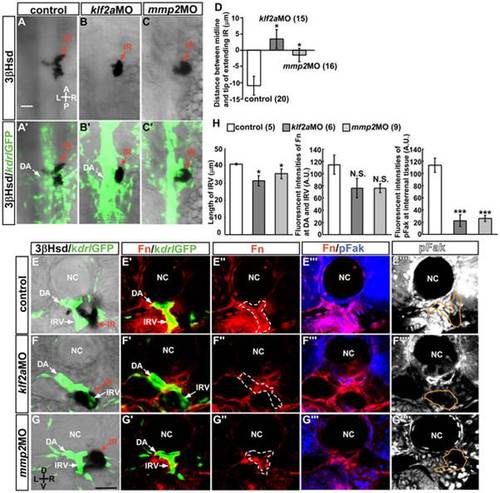
Suppression of interrenal tissue migration in klf2a and mmp2 morphants. Dorsal view of interrenal steroidogenic tissue (IR, red arrows) as detected by 3β-Hsd activity staining, with adjacent vasculature marked by GFP expression. Tg(kdrl: GFP)s843 embryos were (A, A′) uninjected (control), or injected with (B, B′) klf2aMO or (C, C′) mmp2MO. (D) Quantification of the effects of MO-mediated gene knockdown on interrenal migration. The distance between the midline and the migrating tip of steroidogenic tissue was designated as positive if the migrating tip had not reached the midline and negative if it had crossed the midline. The number of embryos in each group is indicated in parentheses. The extent of interrenal medial extension of control 2.5-dpf embryos in panel 5D was not statistically different from those in Figure 2D and 2I. Fn and pFak expression in the interrenal region was examined in (E–E′′′′) uninjected (control), and (F–F′′′′) klf2aMO- and (G–G′′′′) mmp2MO-injected embryos by IHC. Images show transverse sections of a representative embryo from each treatment group. (H) Quantification of the effects of klf2aMO and mmp2MO on IRV growth, Fn level in the vicinity of the DA and IRV (ROI marked by broken lines in E′′–G′′), and pFak level in the steroidogenic tissue (ROI marked by orange lines in E′′′′–G′′′′). The number of embryos in each group is indicated in parentheses. Fluorescence intensities of Fn and pFak were normalized to their respective ROI sizes. The difference between the treatment and the control groups was analyzed by Student′s t-test. *P<0.05, ***P<0.001, N.S., not significant. A, anterior; P, posterior; L, left; R, right; D, dorsal; V, ventral. Abbreviations: notochord (NC). Scale bar, 25 µm.
|